K8s Resource Monitoring
가져오는 방법
Datadog에서 Dashboards → New Dashboard → ⚙ Configure → Import dashboard JSON 순으로 이동한 뒤 이 JSON을 붙여넣으세요.
반응
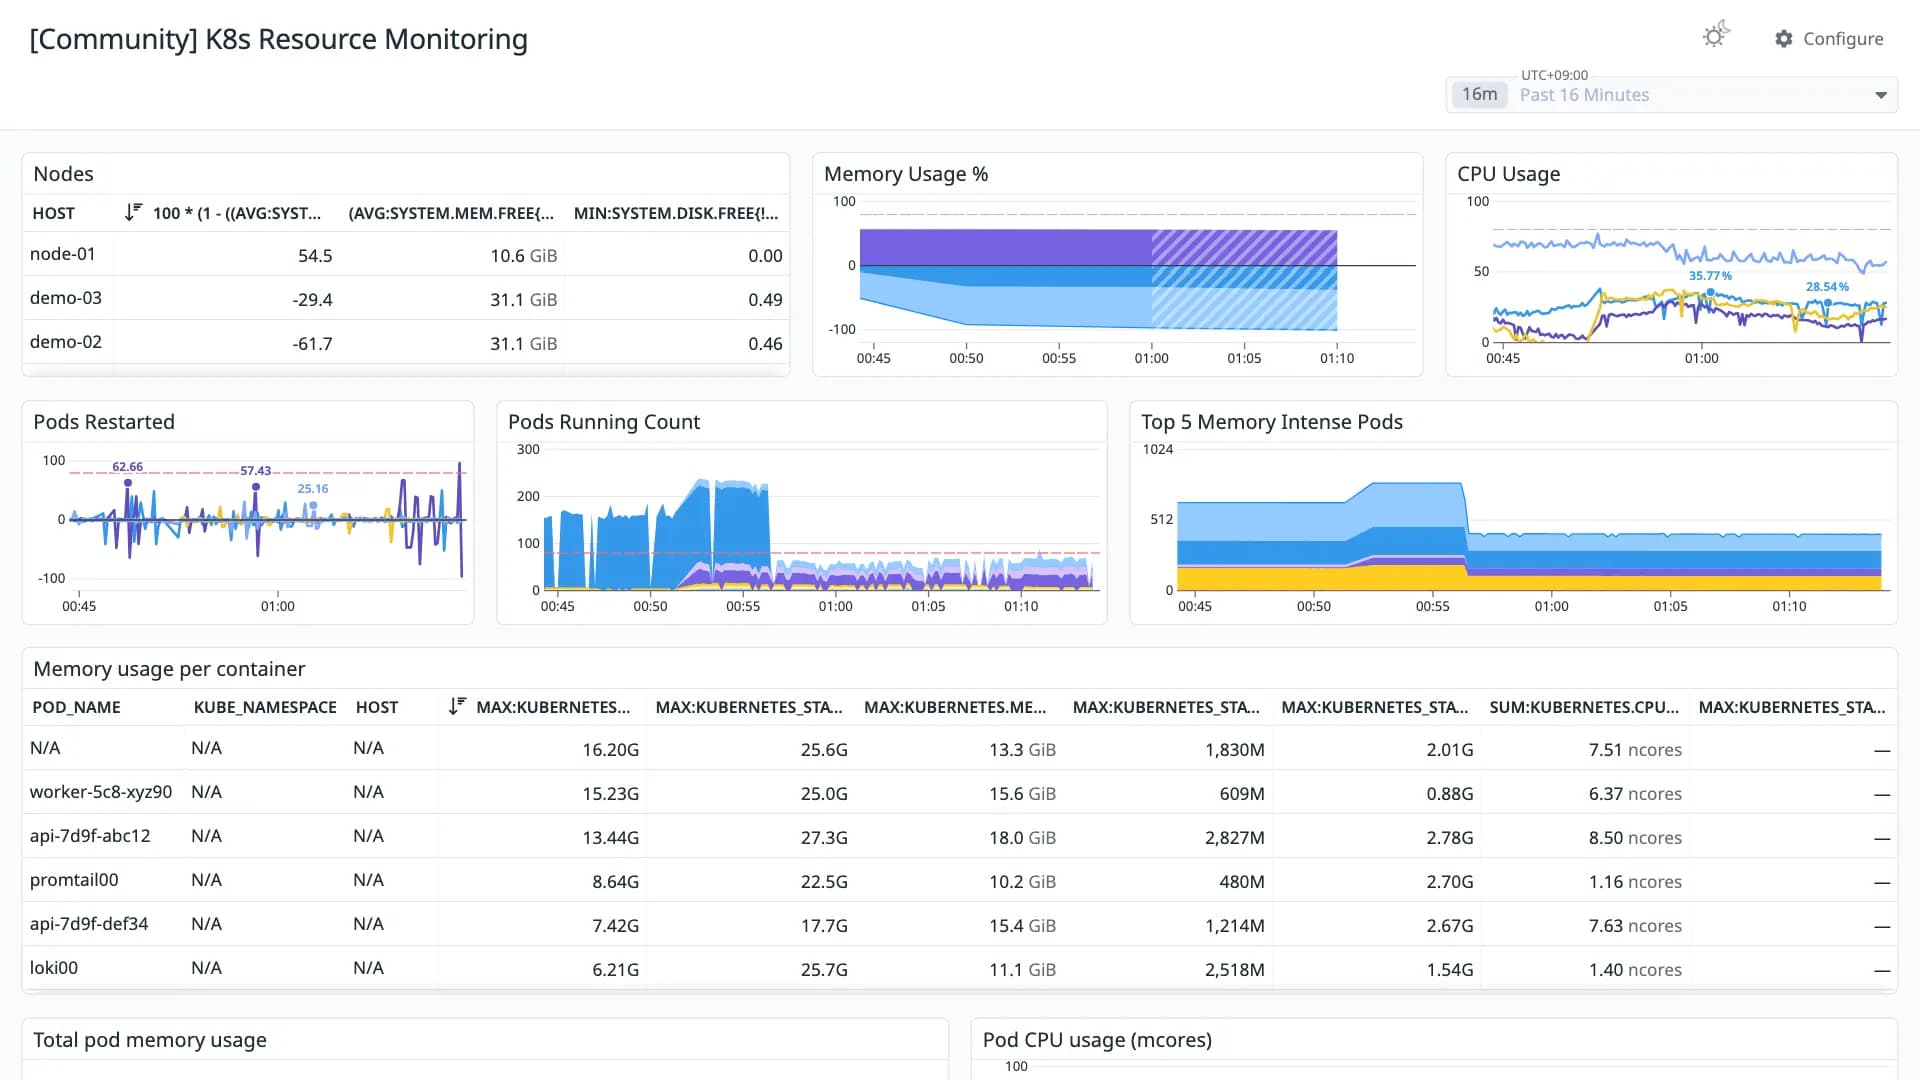
The dashboard offers a simple view of the resource consumption of the deployed pods and their impact on the cluster. The outline of requests and limits for each pod and their totals can be used as a tool to determine appropriate resource quotas for your cluster.
변환 품질
보통 61쿼리가 손실 없이 변환된 패널의 비율입니다. 일부만 변환됐거나 지원되지 않는 패널은 원본 PromQL을 노트 위젯에 그대로 남겨 둡니다.
- 기본 통합2
- OpenMetrics0
- 일부 변환7
- 미지원0
리비전 이력
- 리비전 1Converted from grafana.com revision 1JSON 다운로드
이 대시보드 평가하기
평가하려면 로그인이 필요합니다.댓글 0개
아직 댓글이 없습니다.