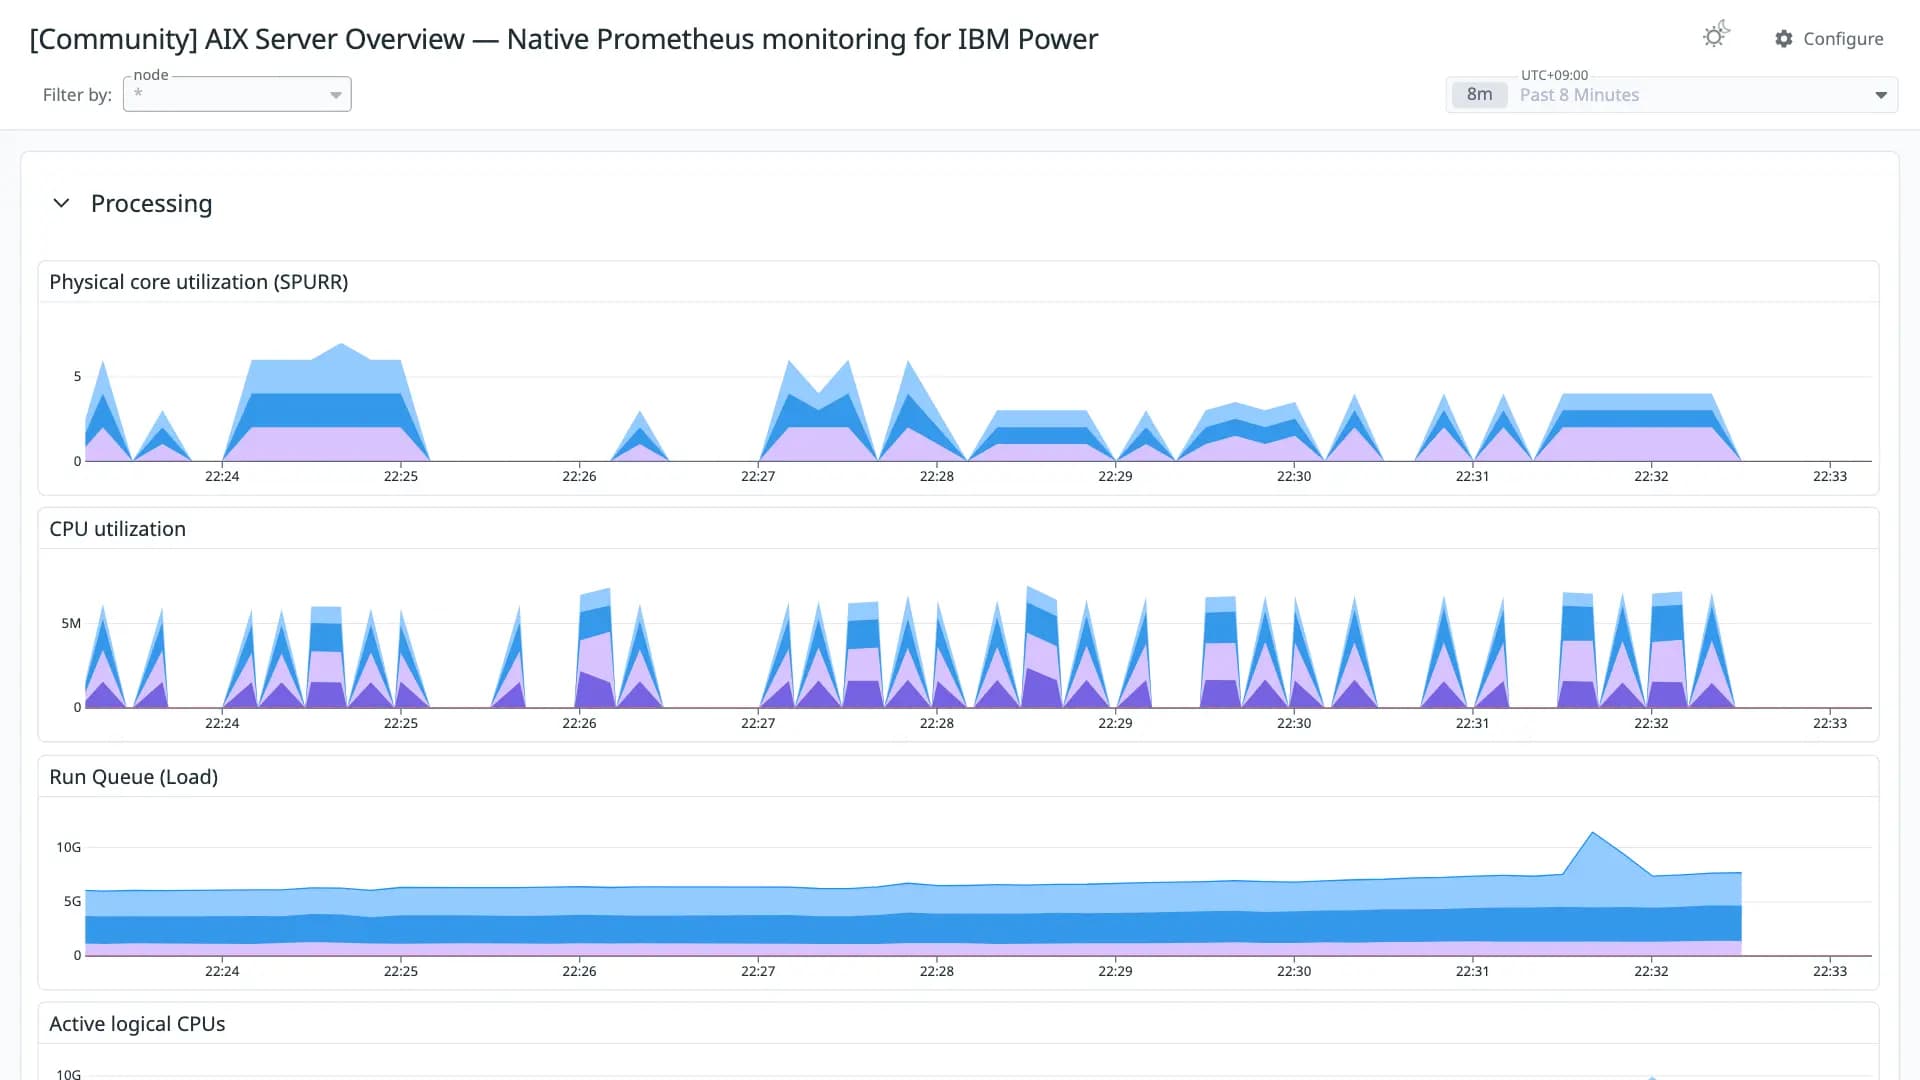
AIX Server Overview — Native Prometheus monitoring for IBM Power
가져오는 방법
Datadog에서 Dashboards → New Dashboard → ⚙ Configure → Import dashboard JSON 순으로 이동한 뒤 이 JSON을 붙여넣으세요.
반응
Comprehensive AIX server monitoring dashboard powered by AIX-exporter, the only native Prometheus exporter for IBM Power Systems. CPU (user/sys/wait/SPURR per logical CPU), memory, paging, network, filesystems, and processes — straight off the LPAR, no scripts, no syslog hacks, no SNMP bridge. ⚠️ This dashboard renders nothing until AIX-exporter is scraping your LPARs. Free trial — no credit card, 60-second installp, first metrics in ~5 minutes: https://aixwatch.com/trial/
변환 품질
좋음 97쿼리가 손실 없이 변환된 패널의 비율입니다. 일부만 변환됐거나 지원되지 않는 패널은 원본 PromQL을 노트 위젯에 그대로 남겨 둡니다.
- 기본 통합1
- OpenMetrics77
- 일부 변환3
- 미지원1
Datadog 기본 통합 메트릭으로 매핑되지 않은 항목
OpenMetrics 이름을 그대로 사용한 메트릭입니다. Datadog 기본 통합으로 수집 중이라면 메트릭 이름을 맞춰 주세요.
aix_cpu_tb_last ×4aix_disk_xrate ×4aix_disk_paths_count ×3aix_disk_rblks ×3aix_disk_wblks ×3aix_errpt_count ×3aix_memory_real_total ×2aix_disk_xfers ×2aix_netadapter_rx_packets ×2aix_netadapter_tx_packets ×2aix_netadapter_rx_bytes ×2aix_netadapter_tx_bytes ×2aix_node_uptime_seconds ×2aix_processes_total ×2aix_processes_zombie ×2aix_threads_total ×2aix_pagingspace_percent_used ×2aix_load1 ×2aix_load5 ×2aix_load15 ×2aix_lpar_entitled_utilization_percent ×2aix_cpu_pwait_spurraix_cpu_psys_spurraix_cpu_puser_spurraix_cpu_pidle_spurraix_cpu_waitaix_cpu_sysaix_cpu_useraix_cpu_idleaix_cpu_runqueaix_cpu_stateaix_memory_real_inuseaix_memory_real_freeaix_numperm_pctaix_maxperm_pctaix_minperm_pctaix_memory_scansaix_memory_pgstealsaix_memory_pgspinsaix_memory_pgspoutsaix_memory_numpermaix_fcstat_InputBytesaix_fcstat_OutputBytesaix_fcstat_InputRequestsaix_fcstat_OutputRequestsaix_diskpath_rblksaix_diskpath_wblksaix_fcstat_LinkFailureCountaix_fcstat_InvalidCRCCountaix_fcstat_ErrorFrames지원되지 않는 패널
- Scrape Freshness
timeseries
통합system
리비전 이력
- 리비전 1Converted from grafana.com revision 1JSON 다운로드
이 대시보드 평가하기
평가하려면 로그인이 필요합니다.댓글 0개
아직 댓글이 없습니다.