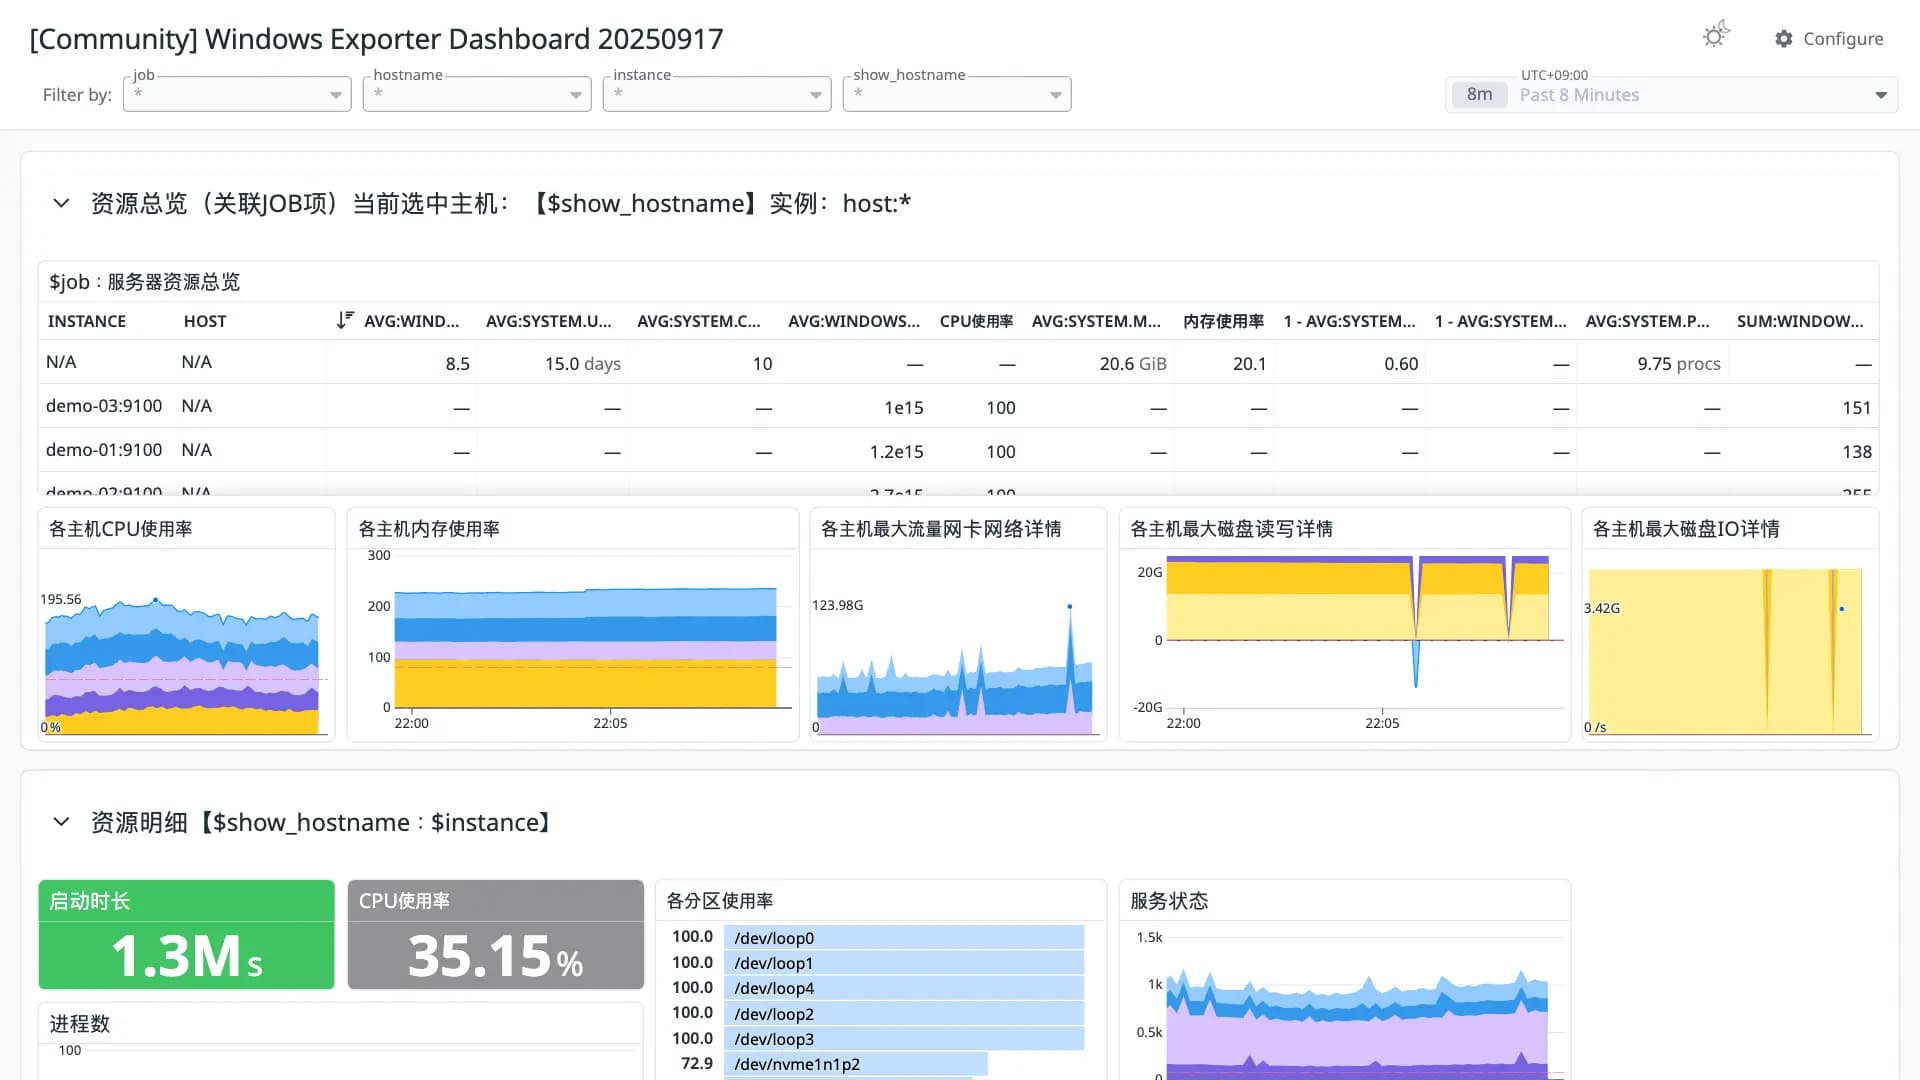
Windows Exporter Dashboard 20250917
Good 900 downloads0 views0 commentsRevision 1Created Converted from Grafana dashboard #24077 by a67878813
How to import
In Datadog: Dashboards → New Dashboard → ⚙ Configure → Import dashboard JSON → paste this JSON.
Reactions
Windows的Prometheus监控看板展示.更新支持windows_exporter 0.35
Conversion quality
Good 90Share of panels whose queries were translated without loss. Partial and unsupported panels keep the original PromQL in a note widget.
- Native11
- OpenMetrics8
- Partial5
- Unsupported0
Metrics without a native Datadog mapping
These metric names were kept in OpenMetrics naming. Adjust them if you collect with a native Datadog integration.
windows_cpu_time_total ×2windows_service_state ×2windows_net_bytes_received_total ×2windows_os_infowindows_cpu_core_frequency_mhzwindows_os_physical_memory_free_byteswindows_cs_physical_memory_byteswindows_logical_disk_read_bytes_totalwindows_logical_disk_write_bytes_totalwindows_logical_disk_reads_totalwindows_logical_disk_writes_totalprocess_virtual_memory_byteswindows_os_virtual_memory_free_byteswindows_logical_disk_free_byteswindows_logical_disk_size_byteswindows_net_bytes_sent_totalwindows_net_bytes_totalwindows_net_current_bandwidth_byteswindows_net_packets_outbound_discarded_totalwindows_net_packets_outbound_errors_totalwindows_net_packets_received_discarded_totalwindows_net_packets_received_errors_totalwindows_system_threadswindows_system_exception_dispatches_totalIntegrationssystem
Revisions
- Revision 1Converted from grafana.com revision 1Download JSON
Rate this dashboard
Sign in to rate.0 comments
No comments yet.