Prometheus2.0 - Shard/Replica
Poor 440 downloads0 views0 commentsRevision 1Created Converted from Grafana dashboard #23639 by poil
How to import
In Datadog: Dashboards → New Dashboard → ⚙ Configure → Import dashboard JSON → paste this JSON.
Reactions
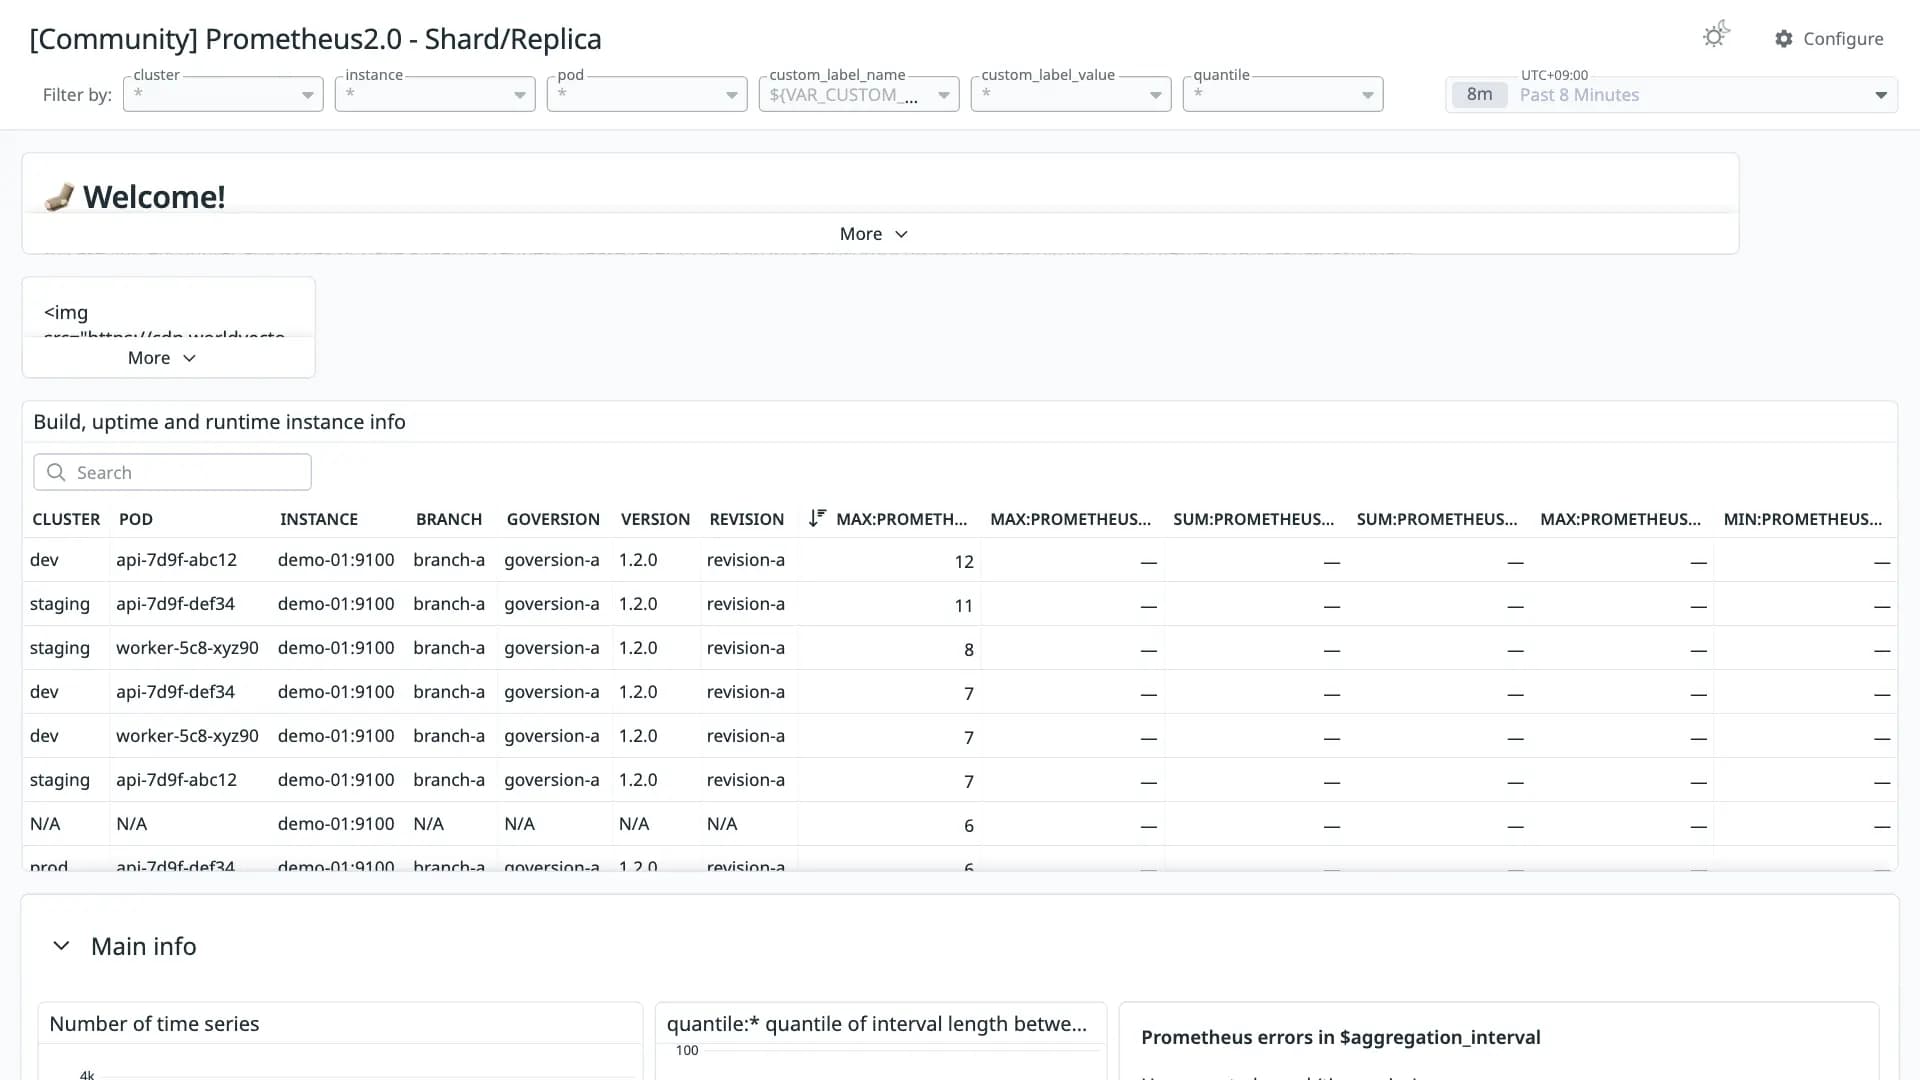
Dashboard providing insight to Prometheus monitoring system status and it's runtime info.
Conversion quality
Poor 44Share of panels whose queries were translated without loss. Partial and unsupported panels keep the original PromQL in a note widget.
- Native2
- OpenMetrics0
- Partial36
- Unsupported7
Metrics without a native Datadog mapping
These metric names were kept in OpenMetrics naming. Adjust them if you collect with a native Datadog integration.
prometheus_tsdb_head_series ×5prometheus_sd_kubernetes_http_request_duration_seconds_count ×4prometheus_remote_storage_succeeded_samples_total ×4prometheus_rule_group_rules ×3prometheus_sd_discovered_targets ×3prometheus_tsdb_storage_blocks_bytes ×3prometheus_target_interval_length_seconds ×2prometheus_http_requests_total ×2process_cpu_seconds_total ×2process_resident_memory_bytes ×2go_memstats_alloc_bytes ×2go_memstats_alloc_bytes_total ×2prometheus_engine_queries ×2prometheus_engine_queries_concurrent_max ×2prometheus_engine_query_duration_seconds ×2prometheus_api_remote_read_queries ×2prometheus_rule_group_last_duration_seconds ×2prometheus_rule_group_interval_seconds ×2prometheus_rule_evaluation_duration_seconds ×2prometheus_notifications_queue_length ×2prometheus_notifications_queue_capacity ×2prometheus_notifications_sent_total ×2prometheus_notifications_latency_seconds ×2prometheus_sd_refresh_duration_seconds_count ×2prometheus_sd_consul_rpc_duration_seconds_count ×2prometheus_sd_refresh_duration_seconds ×2consul_rpc_duration_seconds ×2prometheus_sd_file_scan_duration_seconds ×2prometheus_sd_kubernetes_http_request_duration_seconds_sum ×2prometheus_tsdb_compactions_total ×2prometheus_tsdb_vertical_compactions_total ×2prometheus_tsdb_size_retentions_total ×2prometheus_tsdb_time_retentions_total ×2prometheus_tsdb_head_chunks ×2prometheus_tsdb_head_samples_appended_total ×2prometheus_tsdb_wal_fsync_duration_seconds ×2prometheus_tsdb_wal_completed_pages_total ×2prometheus_tsdb_wal_truncate_duration_seconds_sum ×2prometheus_tsdb_wal_truncate_duration_seconds_count ×2prometheus_remote_storage_remote_read_queries ×2prometheus_remote_storage_sent_batch_duration_seconds_bucket ×2prometheus_remote_storage_shards ×2prometheus_remote_storage_shard_capacity ×2go_goroutines ×2go_gc_duration_seconds ×2go_memstats_mspan_sys_bytes ×2go_memstats_mcache_sys_bytes ×2go_memstats_buck_hash_sys_bytes ×2go_memstats_gc_sys_bytes ×2go_memstats_other_sys_bytes ×2Unsupported panels
- Build, uptime and runtime instance info
table - Prometheus errors in $aggregation_interval
timeseries - $quantile quantile of HTTP request duration per handler
timeseries - $quantile of request size by handler
timeseries - Oldest data
timeseries - $quantile quantile of compaction duration
timeseries - $quantile quantile of batch send call duration to remote storage
timeseries
Revisions
- Revision 1Converted from grafana.com revision 1Download JSON
Rate this dashboard
Sign in to rate.0 comments
No comments yet.