Prometheus Blackbox Exporter
Good 920 downloads0 views0 commentsRevision 1Created Converted from Grafana dashboard #14928 by aaabramov
How to import
In Datadog: Dashboards → New Dashboard → ⚙ Configure → Import dashboard JSON → paste this JSON.
Reactions
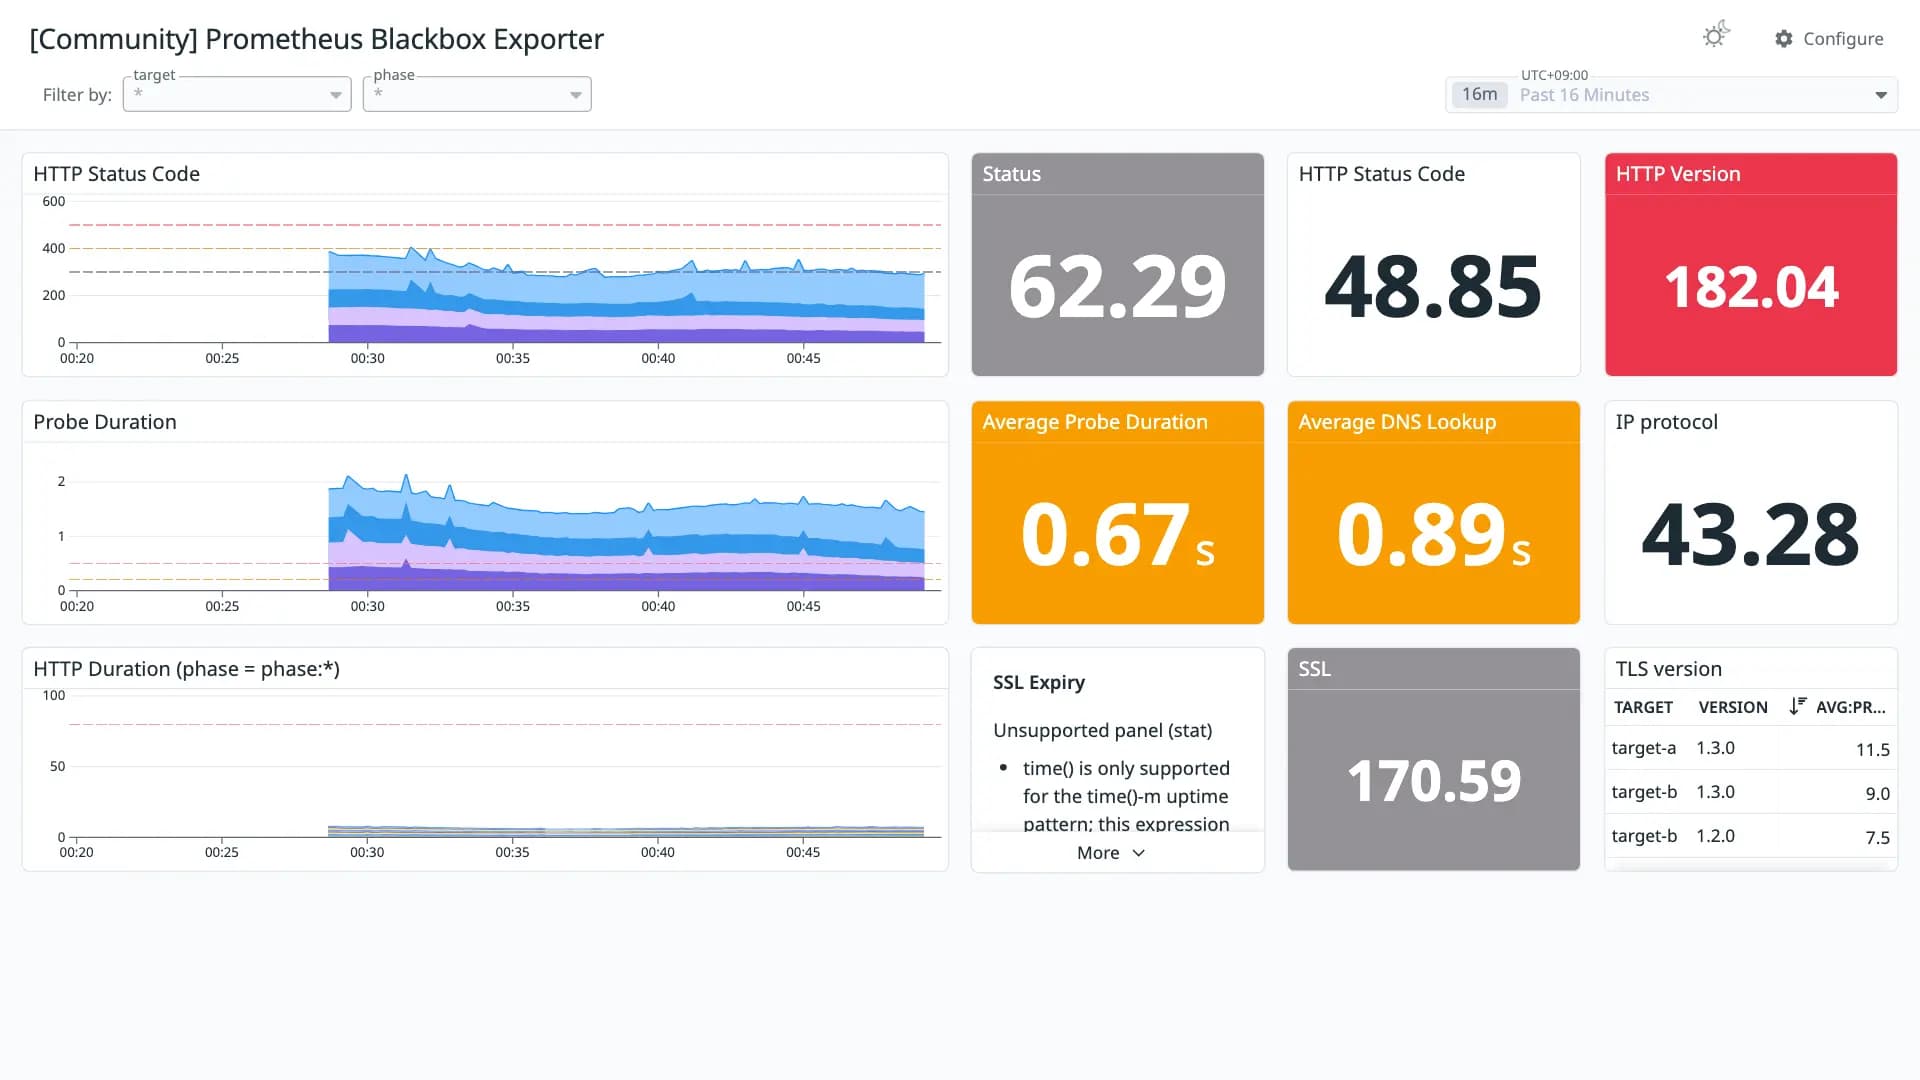
Prometheus Blackbox Exporter Overview
Conversion quality
Good 92Share of panels whose queries were translated without loss. Partial and unsupported panels keep the original PromQL in a note widget.
- Native0
- OpenMetrics11
- Partial0
- Unsupported1
Metrics without a native Datadog mapping
These metric names were kept in OpenMetrics naming. Adjust them if you collect with a native Datadog integration.
probe_http_status_code ×2probe_duration_seconds ×2probe_successprobe_http_versionprobe_dns_lookup_time_secondsprobe_ip_protocolprobe_http_duration_secondsprobe_http_sslprobe_tls_version_infoUnsupported panels
- SSL Expiry
stat
Revisions
- Revision 1Converted from grafana.com revision 6Download JSON
Rate this dashboard
Sign in to rate.0 comments
No comments yet.