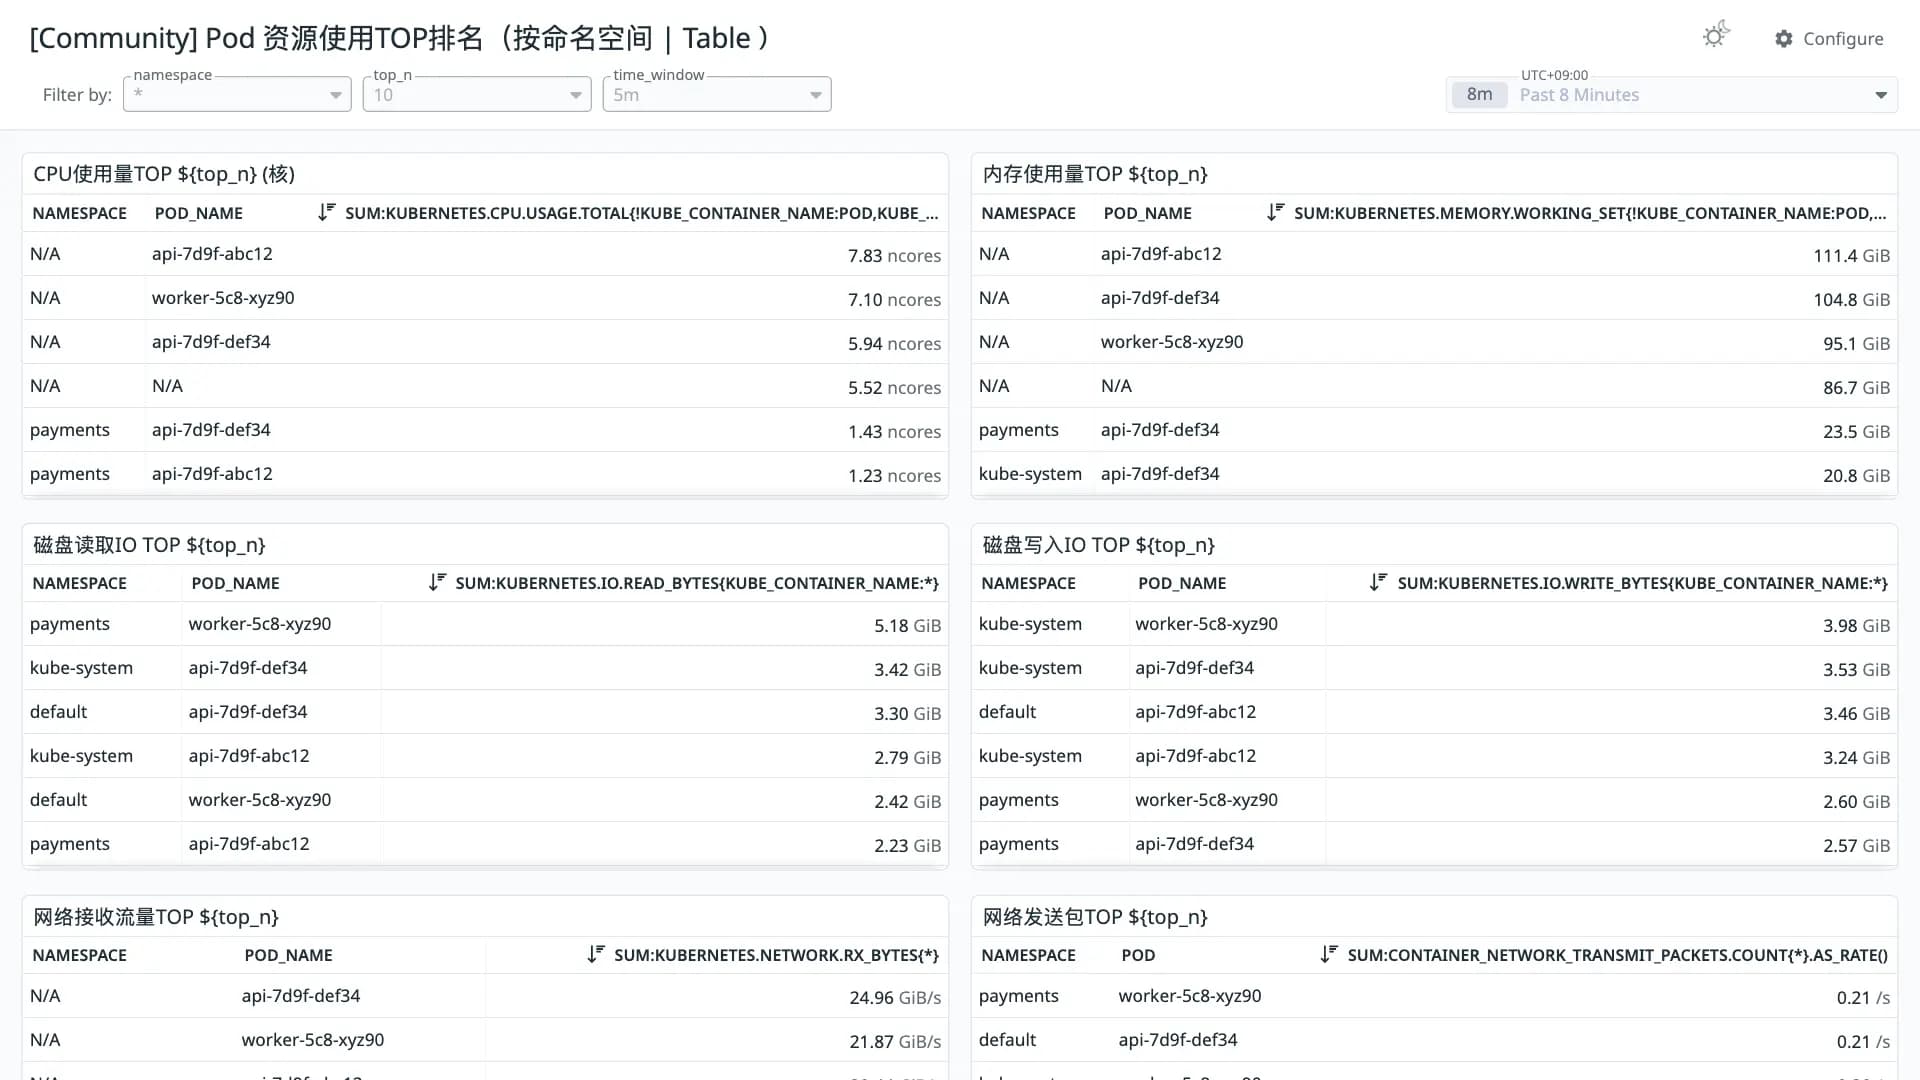
Pod 资源使用TOP排名(按命名空间 | Table)
Good 1000 downloads0 views0 commentsRevision 1Created Converted from Grafana dashboard #24692 by bb2536003833
How to import
In Datadog: Dashboards → New Dashboard → ⚙ Configure → Import dashboard JSON → paste this JSON.
Reactions
此dashboard可用于按命名空间统计并排名 Pod 的 CPU、内存、磁盘 IO、网络流量等资源使用 TOP N,帮助快速定位资源消耗异常的 Pod。
Conversion quality
Good 100Share of panels whose queries were translated without loss. Partial and unsupported panels keep the original PromQL in a note widget.
- Native6
- OpenMetrics2
- Partial0
- Unsupported0
Metrics without a native Datadog mapping
These metric names were kept in OpenMetrics naming. Adjust them if you collect with a native Datadog integration.
container_network_transmit_packets_totalcontainer_network_receive_packets_totalIntegrationskubernetes
Revisions
- Revision 1Converted from grafana.com revision 1Download JSON
Rate this dashboard
Sign in to rate.0 comments
No comments yet.