Pod Stats & Info
Good 850 downloads1 views0 commentsRevision 1Created Converted from Grafana dashboard #10518 by karstensiemer
How to import
In Datadog: Dashboards → New Dashboard → ⚙ Configure → Import dashboard JSON → paste this JSON.
Reactions
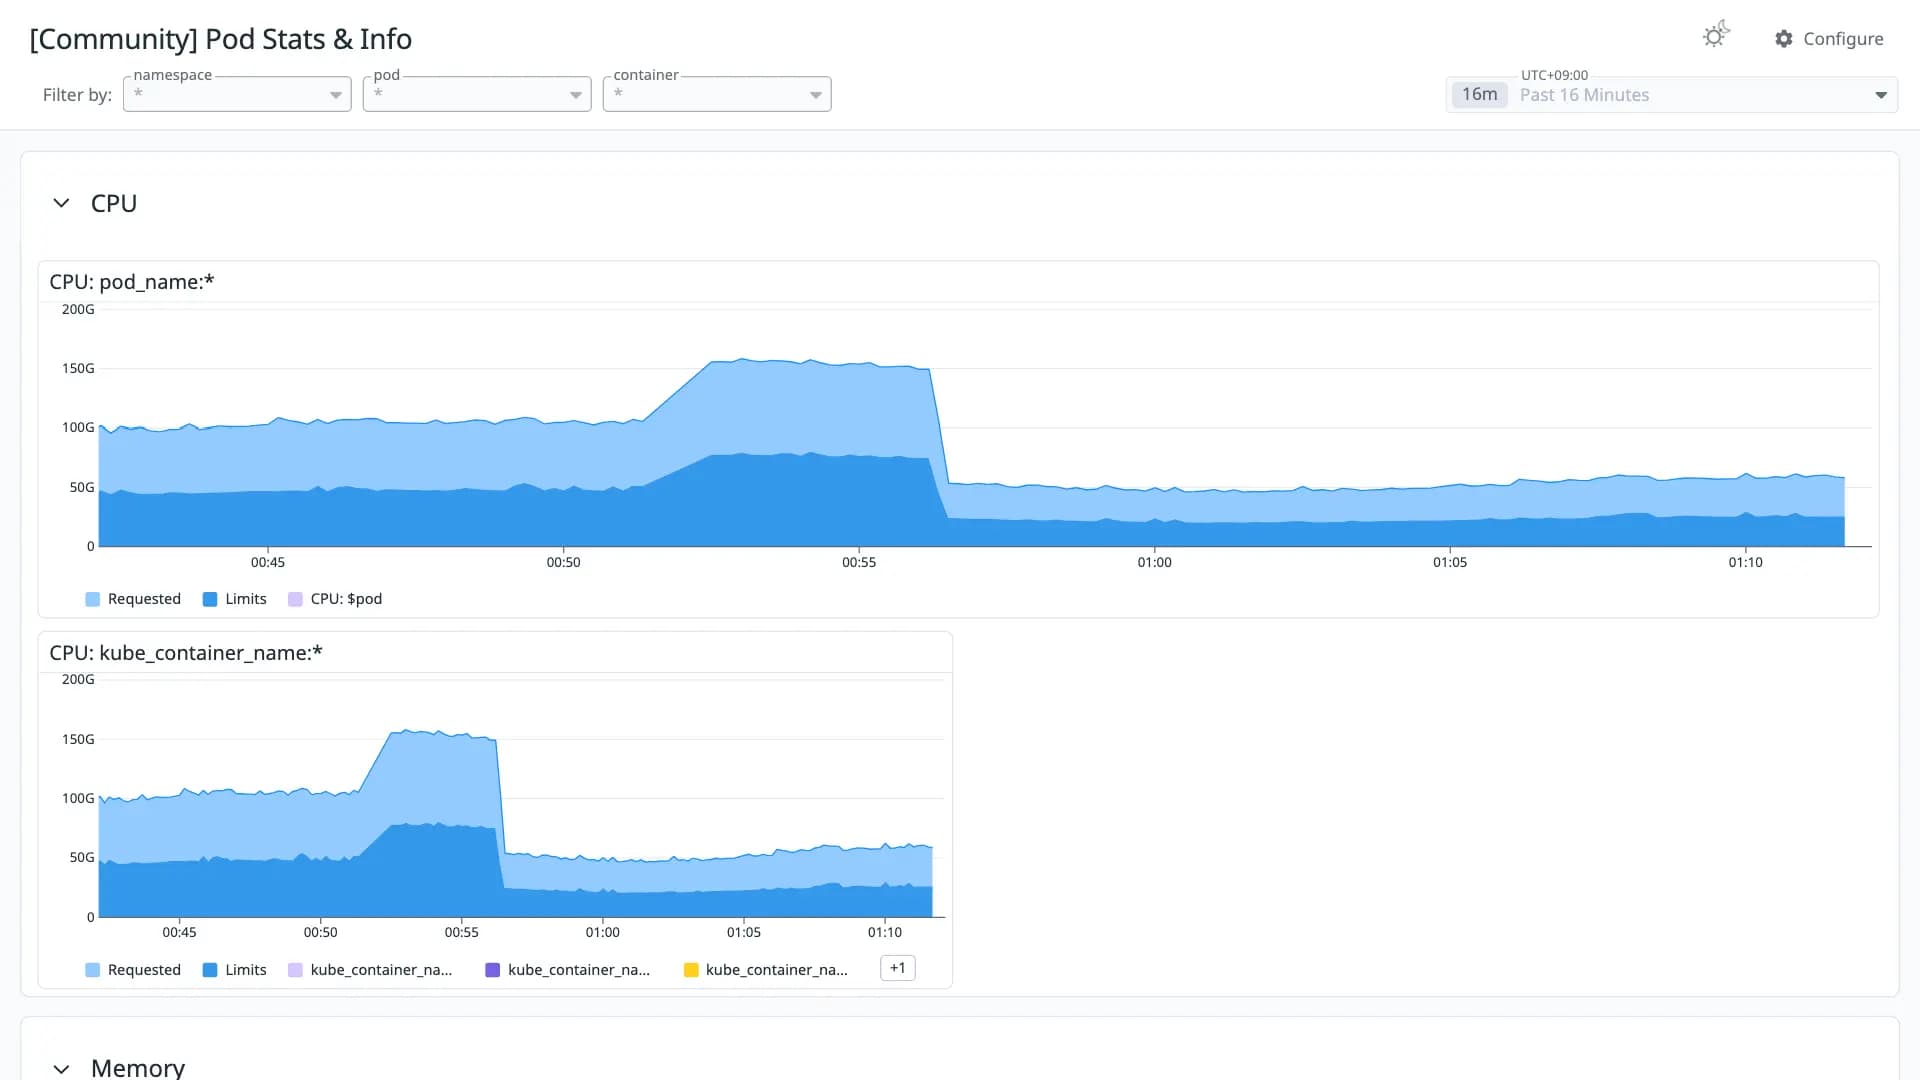
This is for insight on important Kubernetes app metrics. What recources is a Pod actually using and what are it's limits or requests and what part is each container consuming? Also has graphs for networking, disks, restarts docker images etc
Conversion quality
Good 85Share of panels whose queries were translated without loss. Partial and unsupported panels keep the original PromQL in a note widget.
- Native7
- OpenMetrics2
- Partial4
- Unsupported0
Metrics without a native Datadog mapping
These metric names were kept in OpenMetrics naming. Adjust them if you collect with a native Datadog integration.
container_network_receive_packets_total ×2container_network_transmit_packets_total ×2kube_pod_container_status_last_terminated_reasonkube_pod_createdkube_pod_container_infoTagsdocker
Revisions
- Revision 1Converted from grafana.com revision 2Download JSON
Rate this dashboard
Sign in to rate.0 comments
No comments yet.