Docker Container Monitoring — Telegraf + Prometheus (no cAdvisor)
How to import
In Datadog: Dashboards → New Dashboard → ⚙ Configure → Import dashboard JSON → paste this JSON.
Reactions
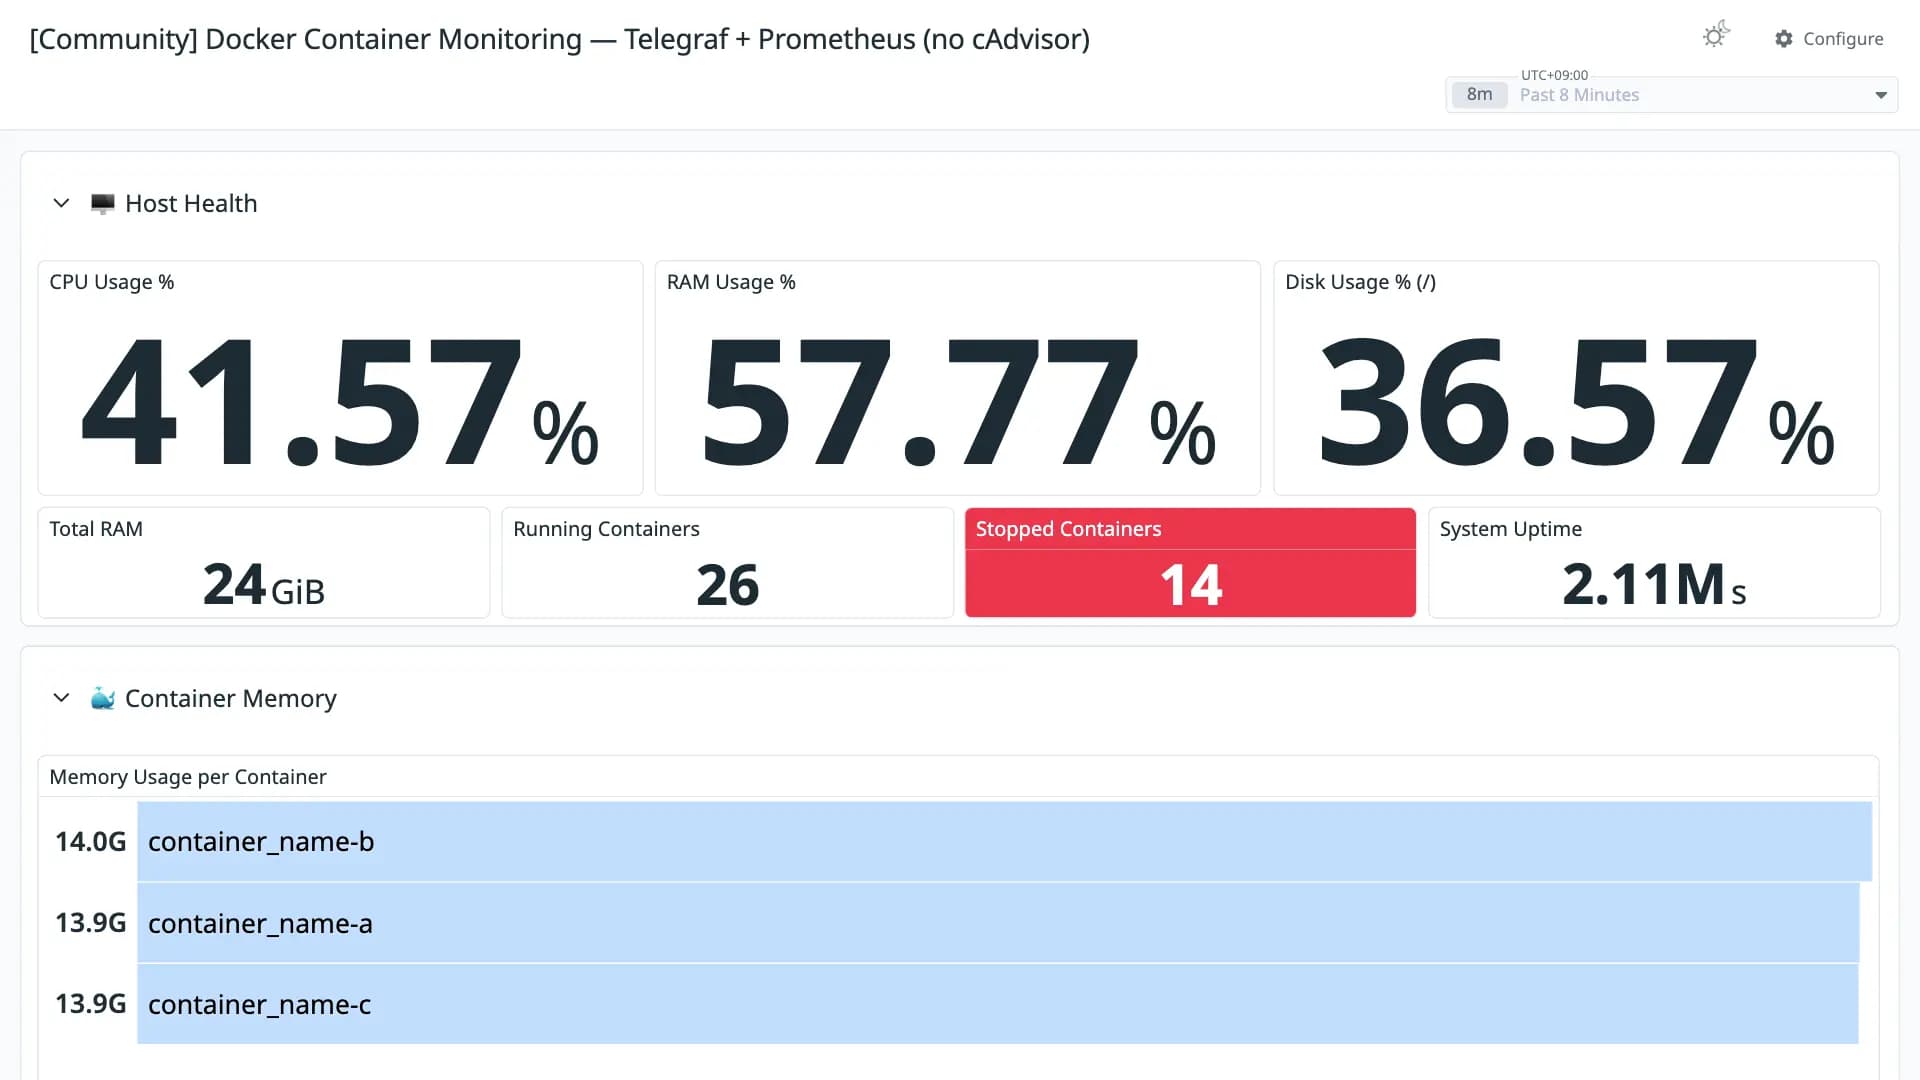
A homelab-focused Docker container dashboard for setups using Telegraf's Docker socket input plugin with Prometheus output — no cAdvisor required. Built for environments where cAdvisor fails due to cgroup v2 incompatibility or non-standard Docker data roots. Panels: host CPU/RAM/disk gauges (via node_exporter), per-container memory bar gauge (deduplicated), CPU % time series, network RX/TX, and a colour-coded summary table sorted by memory usage. Tested on Proxmox + Docker Compose with Telegra
Conversion quality
Good 96Share of panels whose queries were translated without loss. Partial and unsupported panels keep the original PromQL in a note widget.
- Native6
- OpenMetrics5
- Partial1
- Unsupported0
Metrics without a native Datadog mapping
These metric names were kept in OpenMetrics naming. Adjust them if you collect with a native Datadog integration.
docker_container_mem_usage ×2docker_container_cpu_usage_percent ×2docker_container_net_rx_bytesdocker_container_net_tx_bytesRevisions
- Revision 1Converted from grafana.com revision 1Download JSON
Rate this dashboard
Sign in to rate.0 comments
No comments yet.