PHP FPM
Good 860 downloads0 views0 commentsRevision 1Created Converted from Grafana dashboard #25149 by vntrungld
How to import
In Datadog: Dashboards → New Dashboard → ⚙ Configure → Import dashboard JSON → paste this JSON.
Reactions
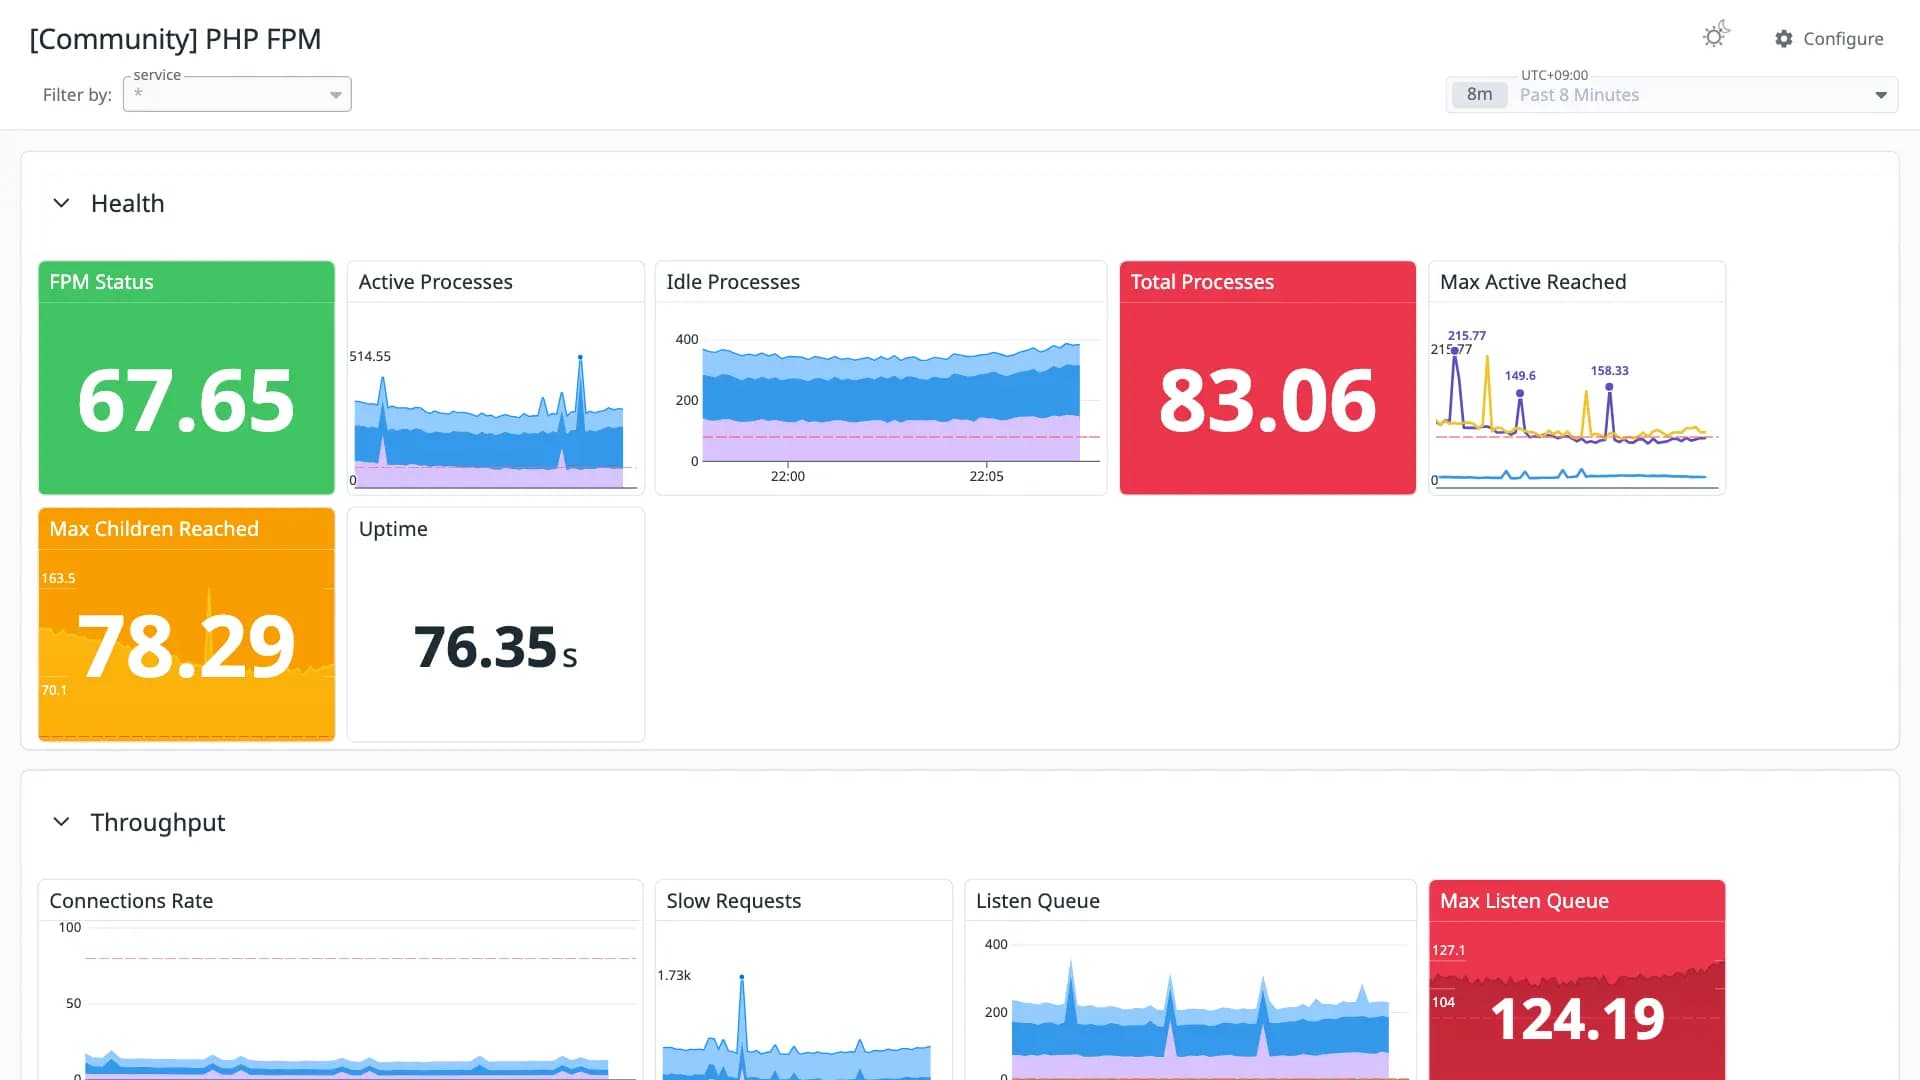
Sample PHP FPM dashboard. Compatible with https://github.com/vntrungld/prometheus-exporter-php-fpm-collector
Conversion quality
Good 86Share of panels whose queries were translated without loss. Partial and unsupported panels keep the original PromQL in a note widget.
- Native0
- OpenMetrics13
- Partial5
- Unsupported0
Metrics without a native Datadog mapping
These metric names were kept in OpenMetrics naming. Adjust them if you collect with a native Datadog integration.
laravel_fpm_process_request_duration ×2laravel_fpm_process_last_request_memory ×2laravel_fpm_uplaravel_fpm_active_processeslaravel_fpm_idle_processeslaravel_fpm_total_processeslaravel_fpm_max_active_processeslaravel_fpm_max_children_reachedlaravel_fpm_start_sincelaravel_fpm_accepted_connectionslaravel_fpm_slow_requestslaravel_fpm_listen_queuelaravel_fpm_max_listen_queuelaravel_fpm_listen_queue_lengthlaravel_fpm_process_request_lengthlaravel_fpm_process_last_request_cpuRevisions
- Revision 1Converted from grafana.com revision 1Download JSON
Rate this dashboard
Sign in to rate.0 comments
No comments yet.