NVIDIA GPU for AI Workloads — Efficiency, Cost & Health (DCGM)
Good 910 downloads0 views0 commentsRevision 1Created Converted from Grafana dashboard #25526 by orangeoctopus1069
How to import
In Datadog: Dashboards → New Dashboard → ⚙ Configure → Import dashboard JSON → paste this JSON.
Reactions
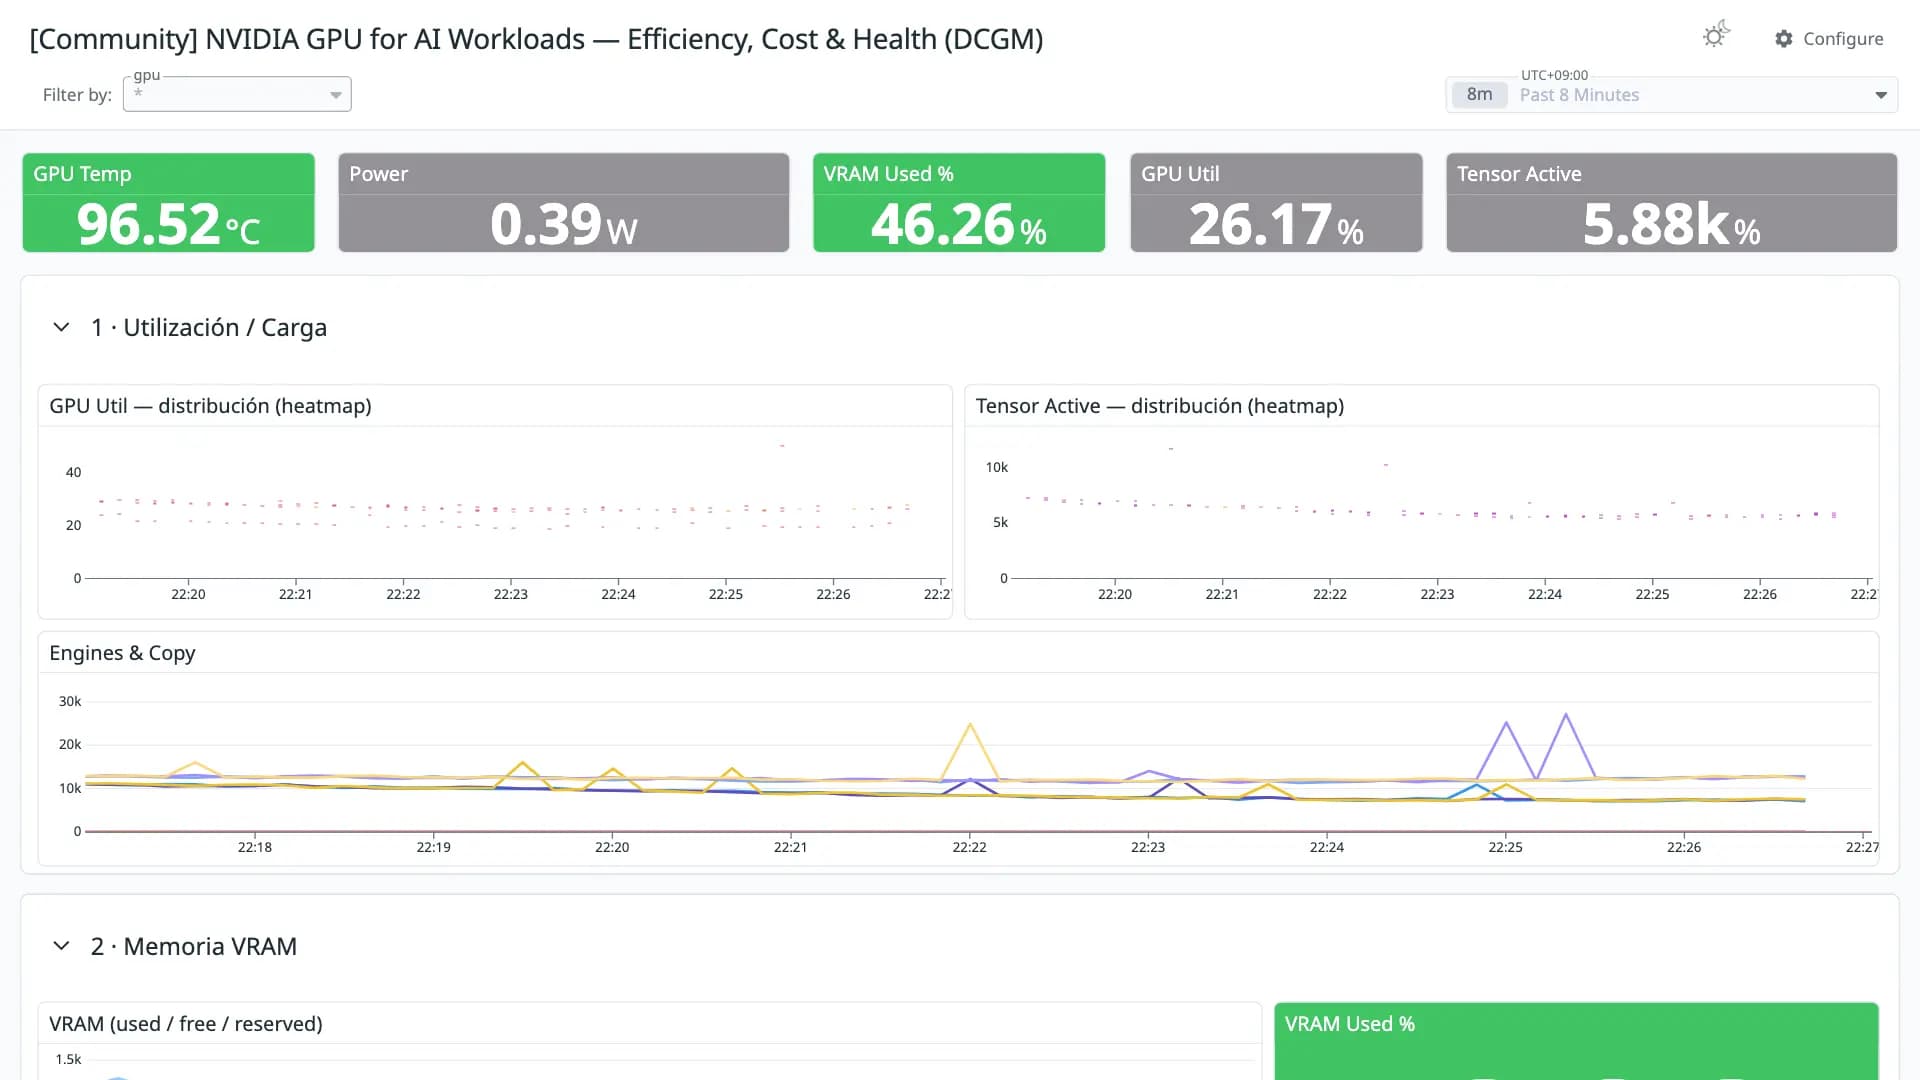
GPU monitoring for self-hosted AI: are your tensor cores actually working, what does each run cost in kWh, and is your VRAM degrading? Built and battle-tested on a local LLM rig (100B+ parameter models). Requires dcgm-exporter with DCP/profiling metrics enabled. Multi-GPU via UUID variable.
Conversion quality
Good 91Share of panels whose queries were translated without loss. Partial and unsupported panels keep the original PromQL in a note widget.
- Native0
- OpenMetrics21
- Partial0
- Unsupported2
Metrics without a native Datadog mapping
These metric names were kept in OpenMetrics naming. Adjust them if you collect with a native Datadog integration.
DCGM_FI_DEV_FB_USED ×3DCGM_FI_DEV_FB_FREE ×3DCGM_FI_DEV_GPU_TEMP ×2DCGM_FI_DEV_POWER_USAGE ×2DCGM_FI_DEV_GPU_UTIL ×2DCGM_FI_PROF_PIPE_TENSOR_ACTIVE ×2DCGM_FI_DEV_TOTAL_ENERGY_CONSUMPTION ×2DCGM_FI_PROF_GR_ENGINE_ACTIVEDCGM_FI_PROF_DRAM_ACTIVEDCGM_FI_DEV_MEM_COPY_UTILDCGM_FI_DEV_ENC_UTILDCGM_FI_DEV_DEC_UTILDCGM_FI_DEV_FB_RESERVEDDCGM_FI_DEV_MEMORY_TEMPDCGM_FI_DEV_SM_CLOCKDCGM_FI_DEV_MEM_CLOCKDCGM_FI_PROF_PCIE_TX_BYTESDCGM_FI_PROF_PCIE_RX_BYTESDCGM_FI_DEV_PCIE_REPLAY_COUNTERDCGM_FI_DEV_CORRECTABLE_REMAPPED_ROWSDCGM_FI_DEV_UNCORRECTABLE_REMAPPED_ROWSDCGM_FI_DEV_ROW_REMAP_FAILUREDCGM_FI_DEV_VGPU_LICENSE_STATUSUnsupported panels
- GPU Temp — distribución (histogram)
histogram - Power — distribución (histogram)
histogram
Revisions
- Revision 1Converted from grafana.com revision 1Download JSON
Rate this dashboard
Sign in to rate.0 comments
No comments yet.