swi
Good 860 downloads0 views0 commentsRevision 1Created Converted from Grafana dashboard #12746 by teymt3
How to import
In Datadog: Dashboards → New Dashboard → ⚙ Configure → Import dashboard JSON → paste this JSON.
Reactions
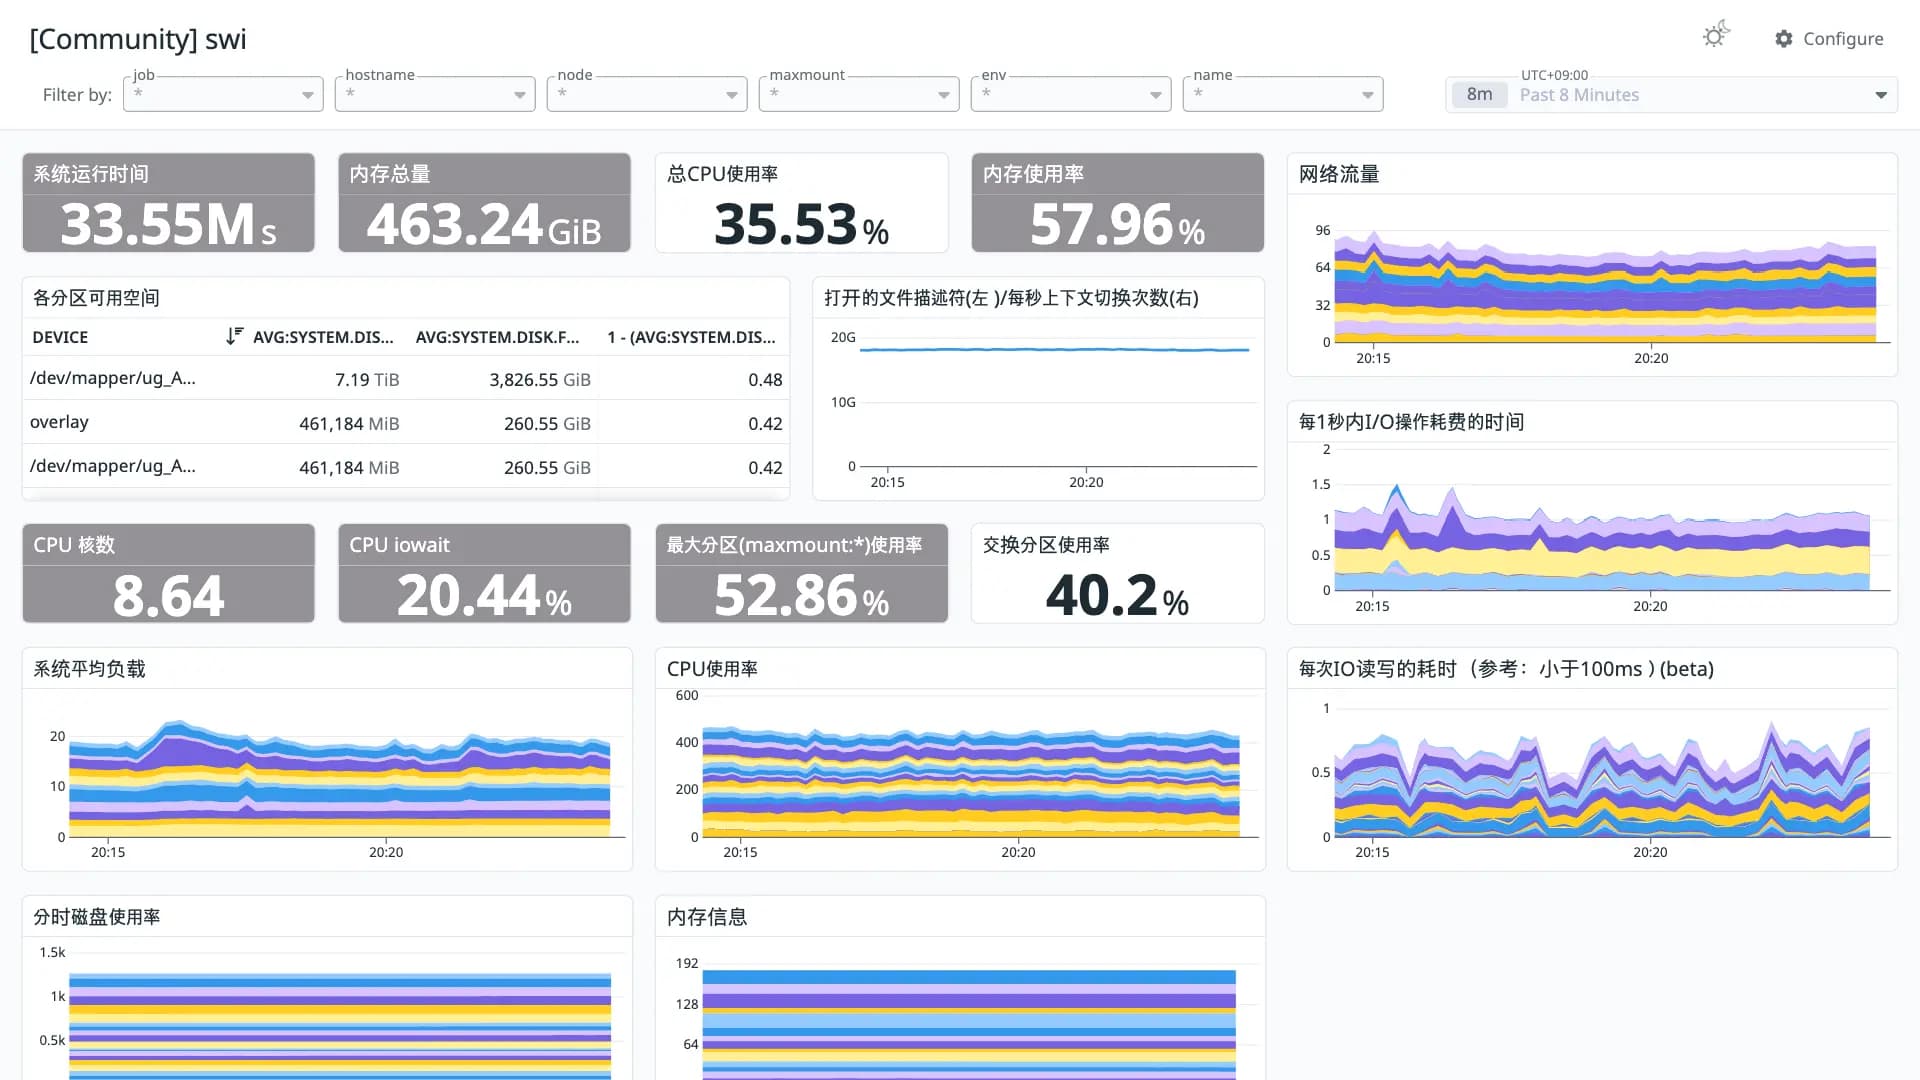
支持 Node Exporter v0.16及以上的版本,精简优化重要指标展示。包含:CPU 内存 磁盘 IO 网络 温度等监控指标。https://github.com/starsliao/Prometheus
Conversion quality
Good 86Share of panels whose queries were translated without loss. Partial and unsupported panels keep the original PromQL in a note widget.
- Native13
- OpenMetrics2
- Partial6
- Unsupported0
Metrics without a native Datadog mapping
These metric names were kept in OpenMetrics naming. Adjust them if you collect with a native Datadog integration.
node_netstat_Tcp_CurrEstabnode_sockstat_TCP_twnode_sockstat_UDP_inusenode_sockstat_TCP_allocnode_hwmon_temp_celsiusIntegrationssystem
Revisions
- Revision 1Converted from grafana.com revision 1Download JSON
Rate this dashboard
Sign in to rate.0 comments
No comments yet.