Node Exporter Dashboard 20240520 TenSunS自动同步版
Fair 710 downloads0 views0 commentsRevision 1Created Converted from Grafana dashboard #8919 by StarsL.cn
How to import
In Datadog: Dashboards → New Dashboard → ⚙ Configure → Import dashboard JSON → paste this JSON.
Reactions
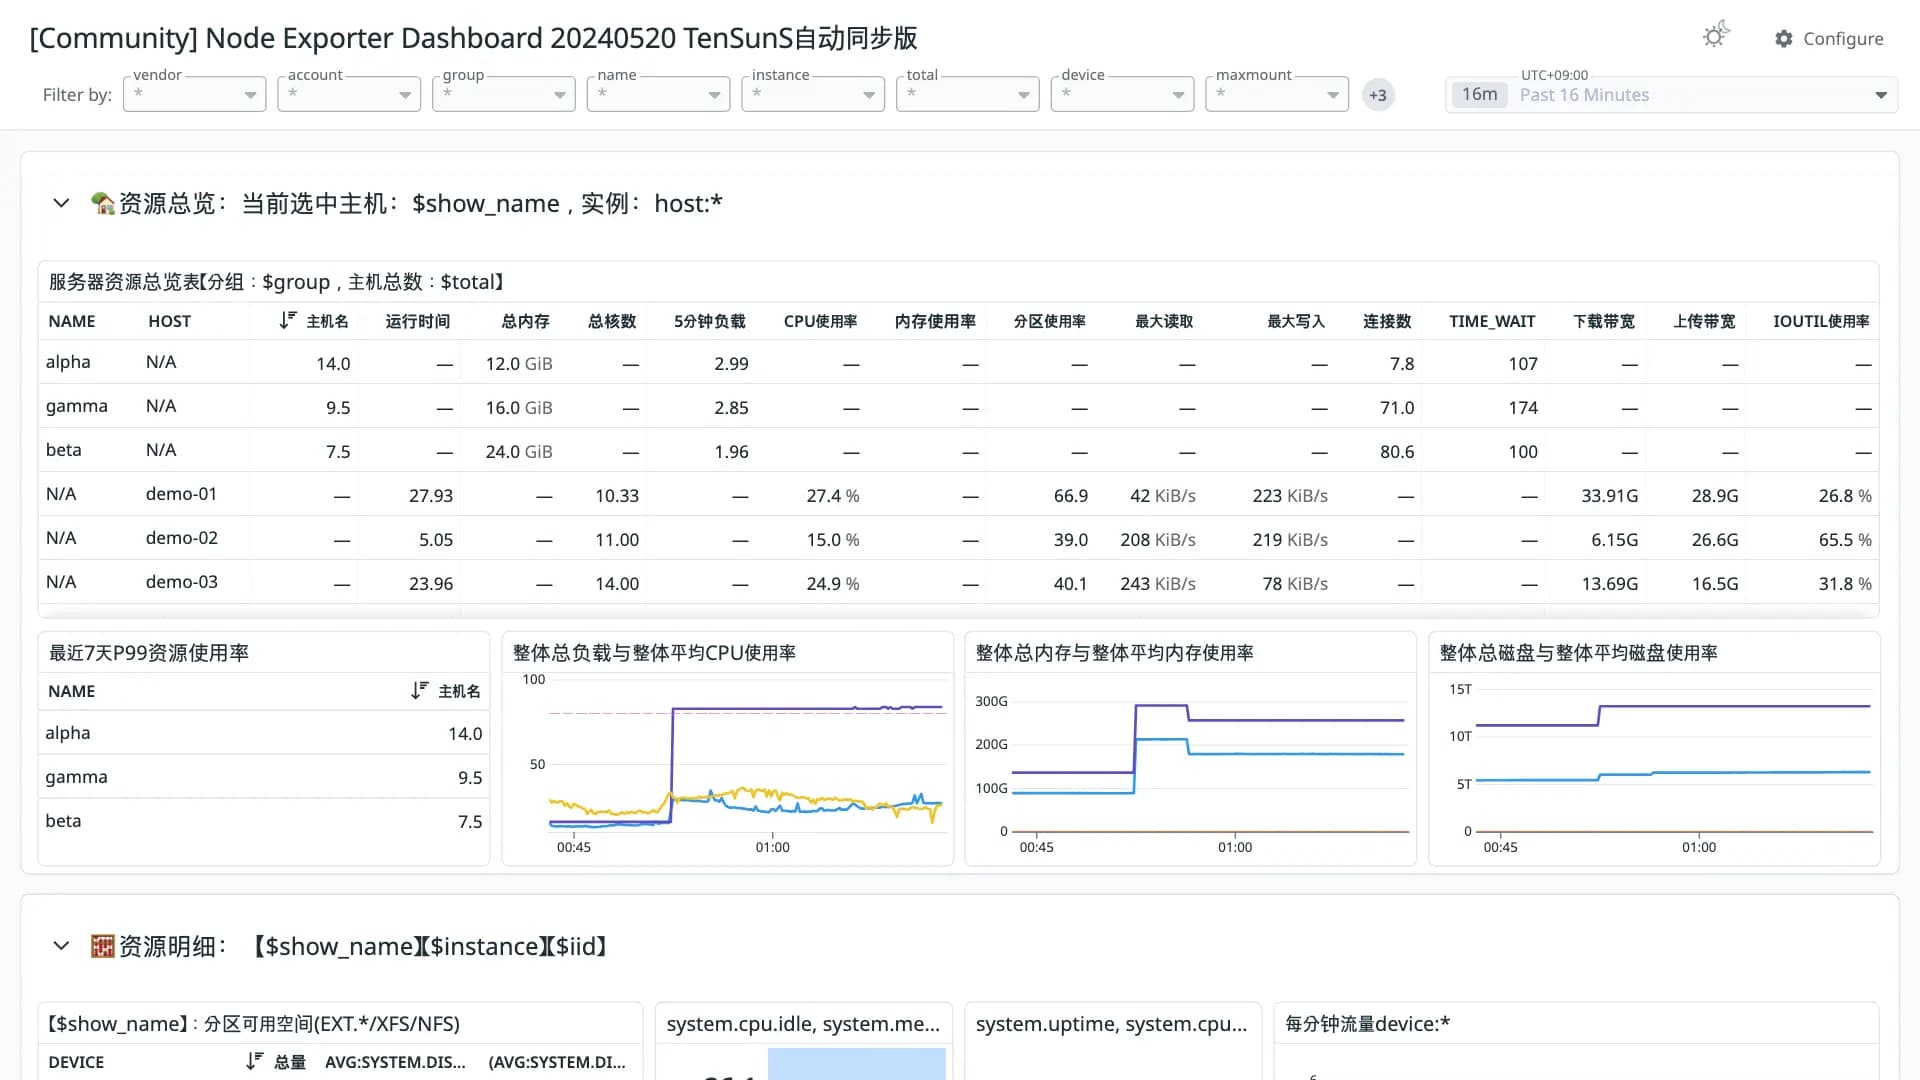
【中文版本】2024.05.20更新,基于TenSunS采集的ECS,可匹配自动同步方式采集ECS信息字段的展示,优化重要指标展示。使用Grafana10新样式重建,新增健康评分概念,并新增了整体资源消耗信息的一些图表。包含整体资源展示与资源明细图表:CPU 内存 磁盘 IO 网络等监控指标。https://github.com/starsliao/TenSunS
Conversion quality
Fair 71Share of panels whose queries were translated without loss. Partial and unsupported panels keep the original PromQL in a note widget.
- Native9
- OpenMetrics2
- Partial8
- Unsupported2
Metrics without a native Datadog mapping
These metric names were kept in OpenMetrics naming. Adjust them if you collect with a native Datadog integration.
node_uname_info ×2node_sockstat_TCP_tw ×2process_max_fds ×2node_filesystem_files_freenode_filesystem_filesprocess_open_fdsnode_disk_write_time_seconds_totalnode_netstat_Tcp_CurrEstabnode_sockstat_UDP_inusenode_sockstat_TCP_allocnode_netstat_Tcp_InSegsnode_netstat_Tcp_OutSegsnode_netstat_Tcp_RetransSegsUnsupported panels
- 服务器资源总览表【分组:$group,主机总数:$total】
table - 最近7天P99资源使用率
table
Integrationssystem
Revisions
- Revision 1Converted from grafana.com revision 26Download JSON
Rate this dashboard
Sign in to rate.0 comments
No comments yet.