Node Exporter JOB分组版
가져오는 방법
Datadog에서 Dashboards → New Dashboard → ⚙ Configure → Import dashboard JSON 순으로 이동한 뒤 이 JSON을 붙여넣으세요.
반응
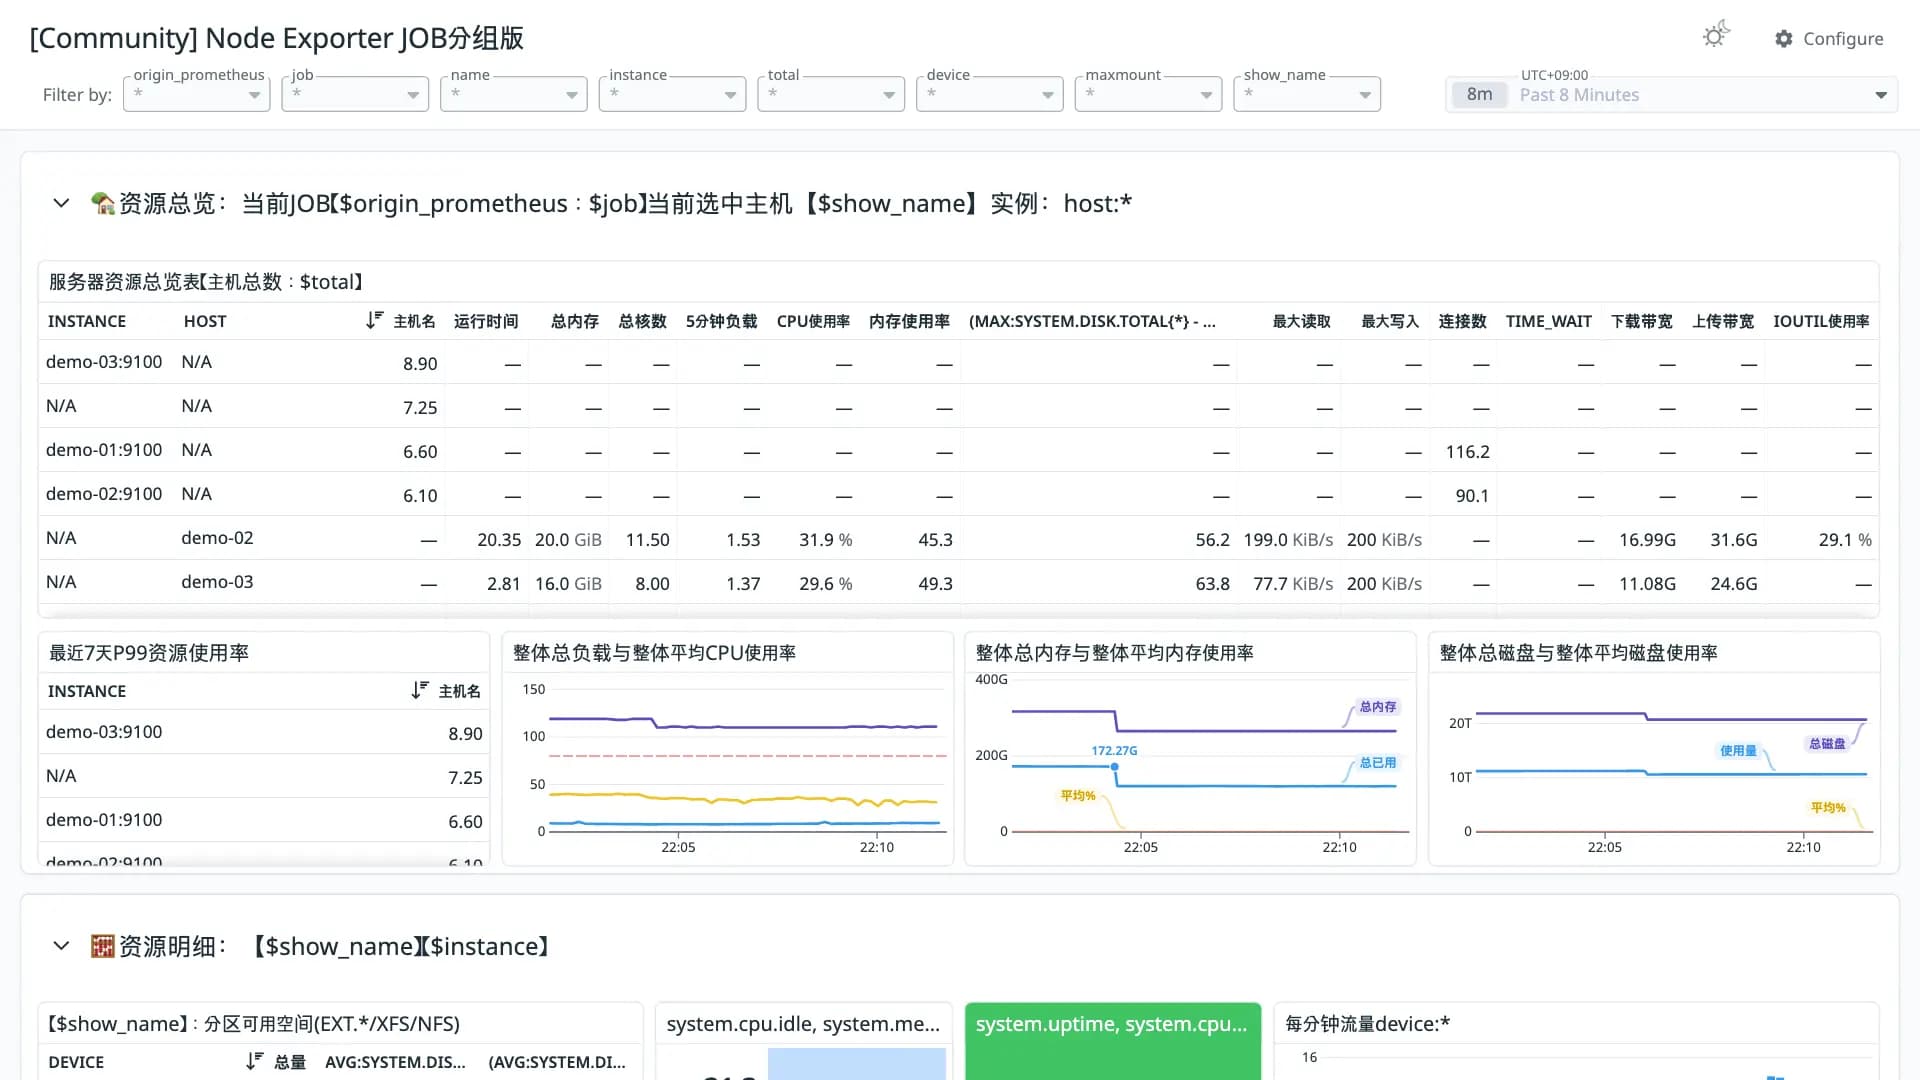
【中文版本】2024.05.22更新,优化重要指标展示。使用Grafana10新样式重建,新增健康评分概念,并新增了整体资源消耗信息的一些图表。包含整体资源展示与资源明细图表:CPU 内存 磁盘 IO 网络等监控指标。https://github.com/starsliao/TenSunS
변환 품질
보통 76쿼리가 손실 없이 변환된 패널의 비율입니다. 일부만 변환됐거나 지원되지 않는 패널은 원본 PromQL을 노트 위젯에 그대로 남겨 둡니다.
- 기본 통합11
- OpenMetrics2
- 일부 변환6
- 미지원2
Datadog 기본 통합 메트릭으로 매핑되지 않은 항목
OpenMetrics 이름을 그대로 사용한 메트릭입니다. Datadog 기본 통합으로 수집 중이라면 메트릭 이름을 맞춰 주세요.
node_uname_info ×2node_netstat_Tcp_CurrEstab ×2node_sockstat_TCP_tw ×2process_max_fds ×2node_filesystem_files_freenode_filesystem_filesprocess_open_fdsnode_disk_write_time_seconds_totalnode_sockstat_UDP_inusenode_sockstat_TCP_allocnode_netstat_Tcp_InSegsnode_netstat_Tcp_OutSegsnode_netstat_Tcp_RetransSegs지원되지 않는 패널
- 服务器资源总览表【主机总数:$total】
table - 最近7天P99资源使用率
table
통합system
리비전 이력
- 리비전 1Converted from grafana.com revision 1JSON 다운로드
이 대시보드 평가하기
평가하려면 로그인이 필요합니다.댓글 0개
아직 댓글이 없습니다.