NGINX Ingress controller
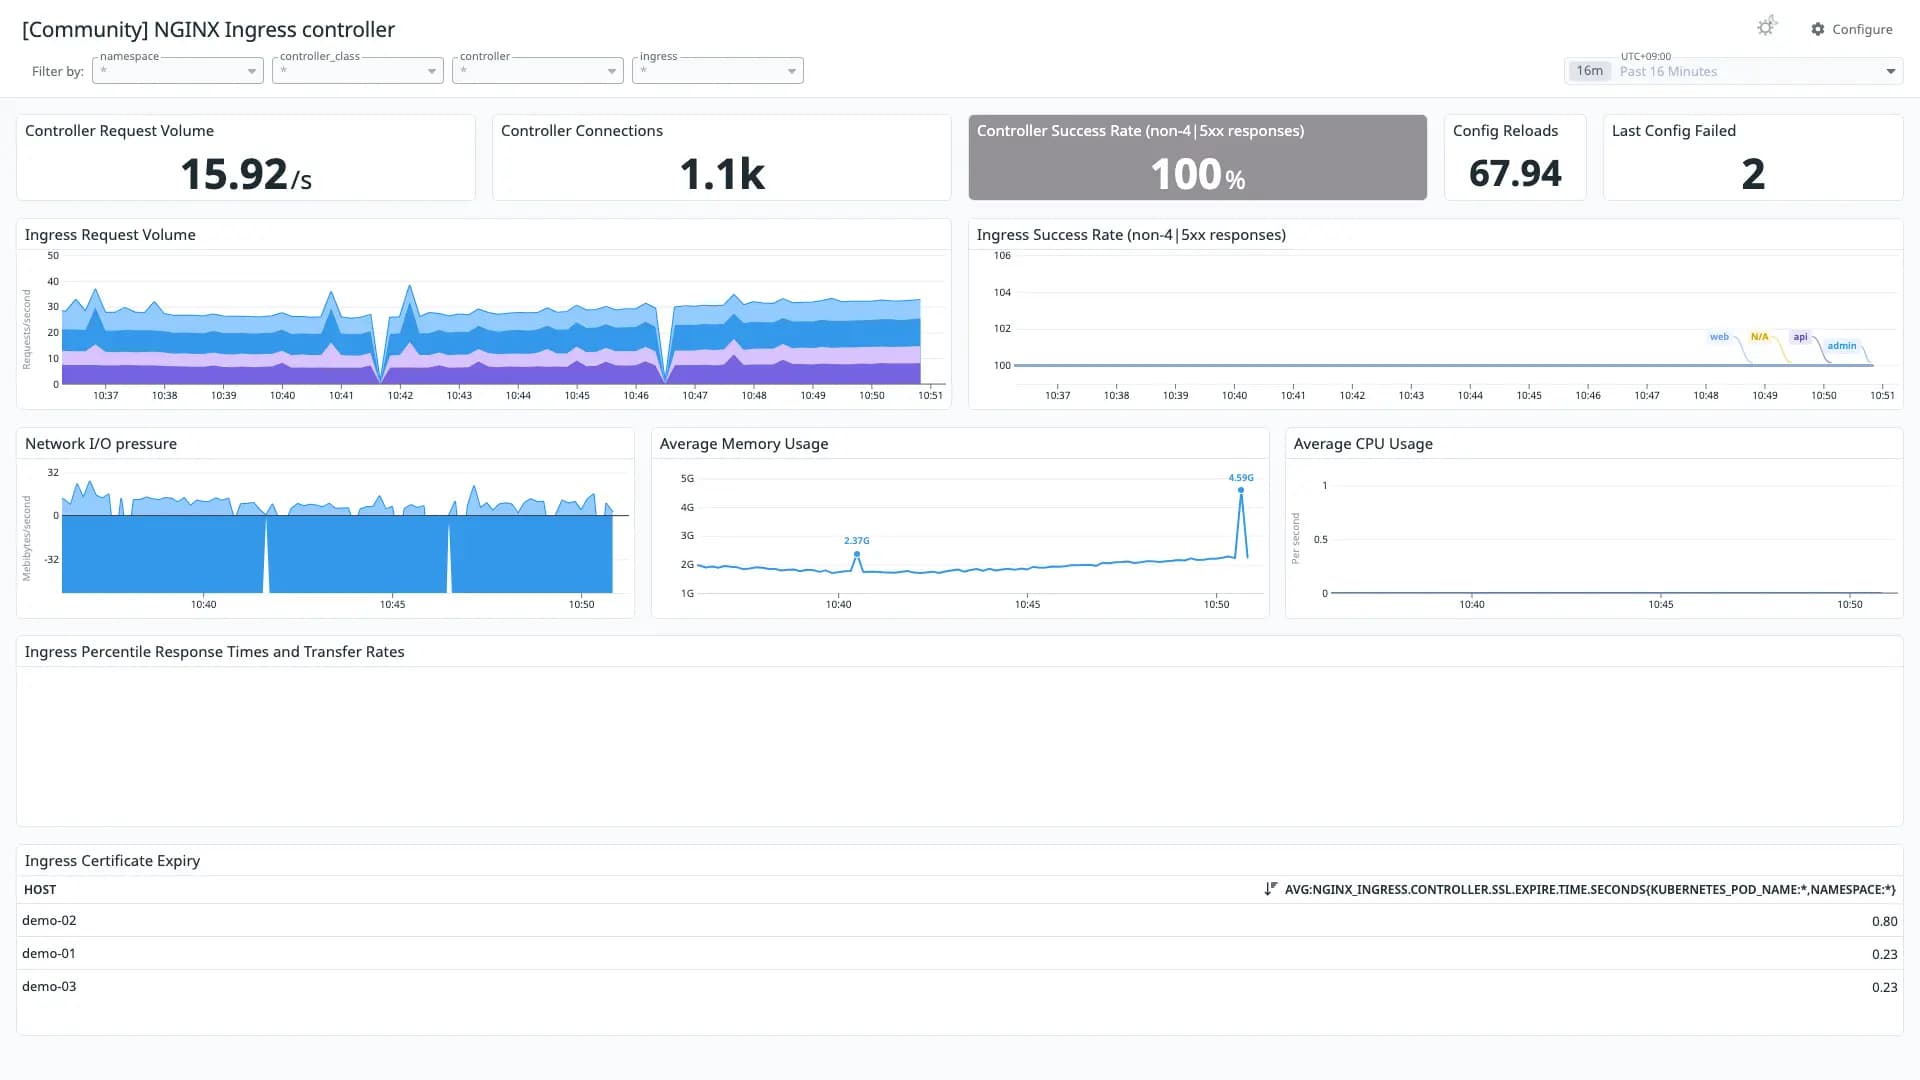
Good 885 downloads2 views0 commentsRevision 1Created Converted from Grafana dashboard #9614 by gonzalesraul
How to import
In Datadog: Dashboards → New Dashboard → ⚙ Configure → Import dashboard JSON → paste this JSON.
Reactions
Ingress-nginx supports a rich collection of prometheus metrics. If you have prometheus and grafana installed on your cluster then prometheus will already be scraping this data due to the scrape annotation on the deployment.
Conversion quality
Good 88Share of panels whose queries were translated without loss. Partial and unsupported panels keep the original PromQL in a note widget.
- Native9
- OpenMetrics0
- Partial3
- Unsupported0
Tagsnginx
Integrationsnginx_ingress
Revisions
- Revision 1Converted from grafana.com revision 1Download JSON
Rate this dashboard
Sign in to rate.0 comments
No comments yet.