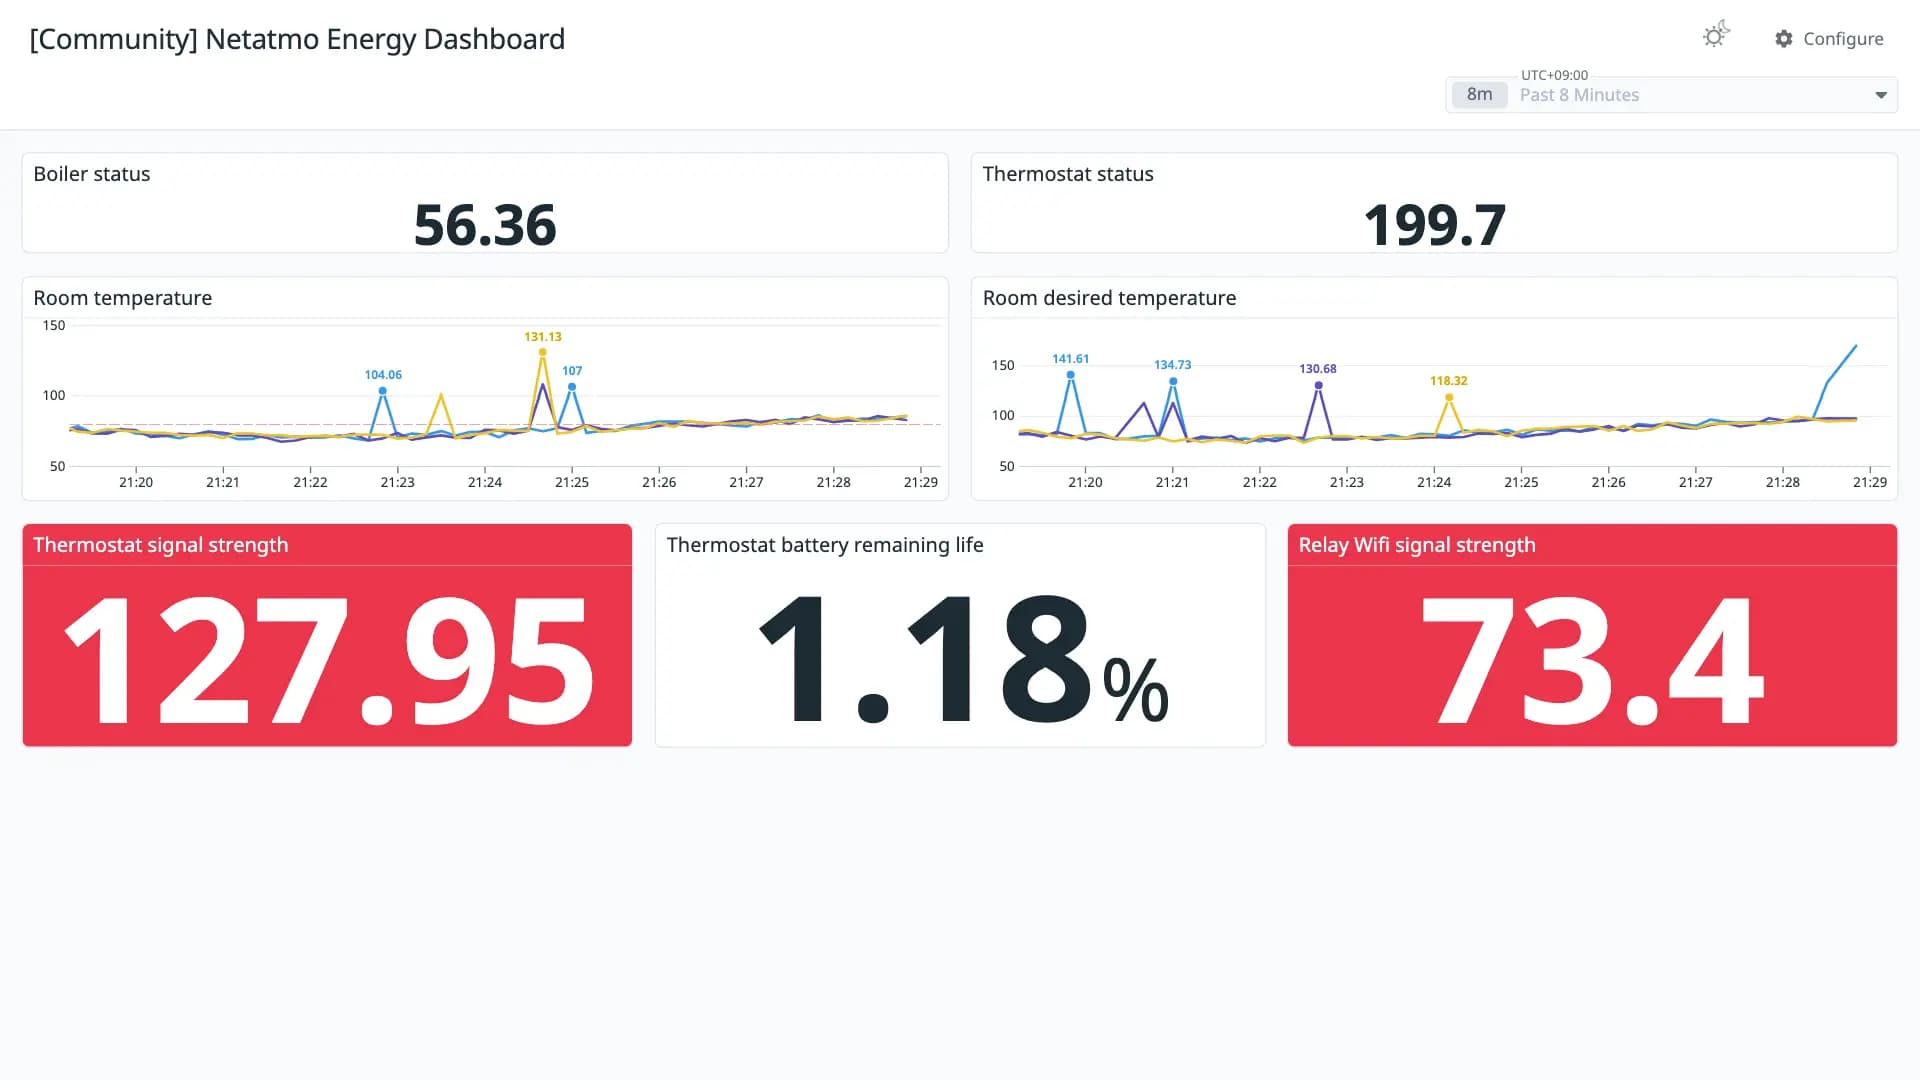
Netatmo Energy Dashboard
Good 1000 downloads0 views0 commentsRevision 1Created Converted from Grafana dashboard #20571 by vladimirremenar
How to import
In Datadog: Dashboards → New Dashboard → ⚙ Configure → Import dashboard JSON → paste this JSON.
Reactions
This dashboard is meant to be used with the Prometheus output Netatmo energy exporter. Docker image: https://hub.docker.com/r/vremenar/netatmo-energy-exporter Image built from: https://github.com/tipok/netatmo_energy_exporter
Conversion quality
Good 100Share of panels whose queries were translated without loss. Partial and unsupported panels keep the original PromQL in a note widget.
- Native0
- OpenMetrics7
- Partial0
- Unsupported0
Metrics without a native Datadog mapping
These metric names were kept in OpenMetrics naming. Adjust them if you collect with a native Datadog integration.
netatmo_module_boiler_statusnetatmo_module_reachablenetatmo_room_temperaturenetatmo_room_sp_temperaturenetatmo_module_rf_strengthnetatmo_module_battery_levelnetatmo_module_wifi_strengthRevisions
- Revision 1Converted from grafana.com revision 1Download JSON
Rate this dashboard
Sign in to rate.0 comments
No comments yet.