MinIO - System - Diagnostics
Fair 650 downloads0 views0 commentsRevision 1Created Converted from Grafana dashboard #25455 by MinIO, Inc
How to import
In Datadog: Dashboards → New Dashboard → ⚙ Configure → Import dashboard JSON → paste this JSON.
Reactions
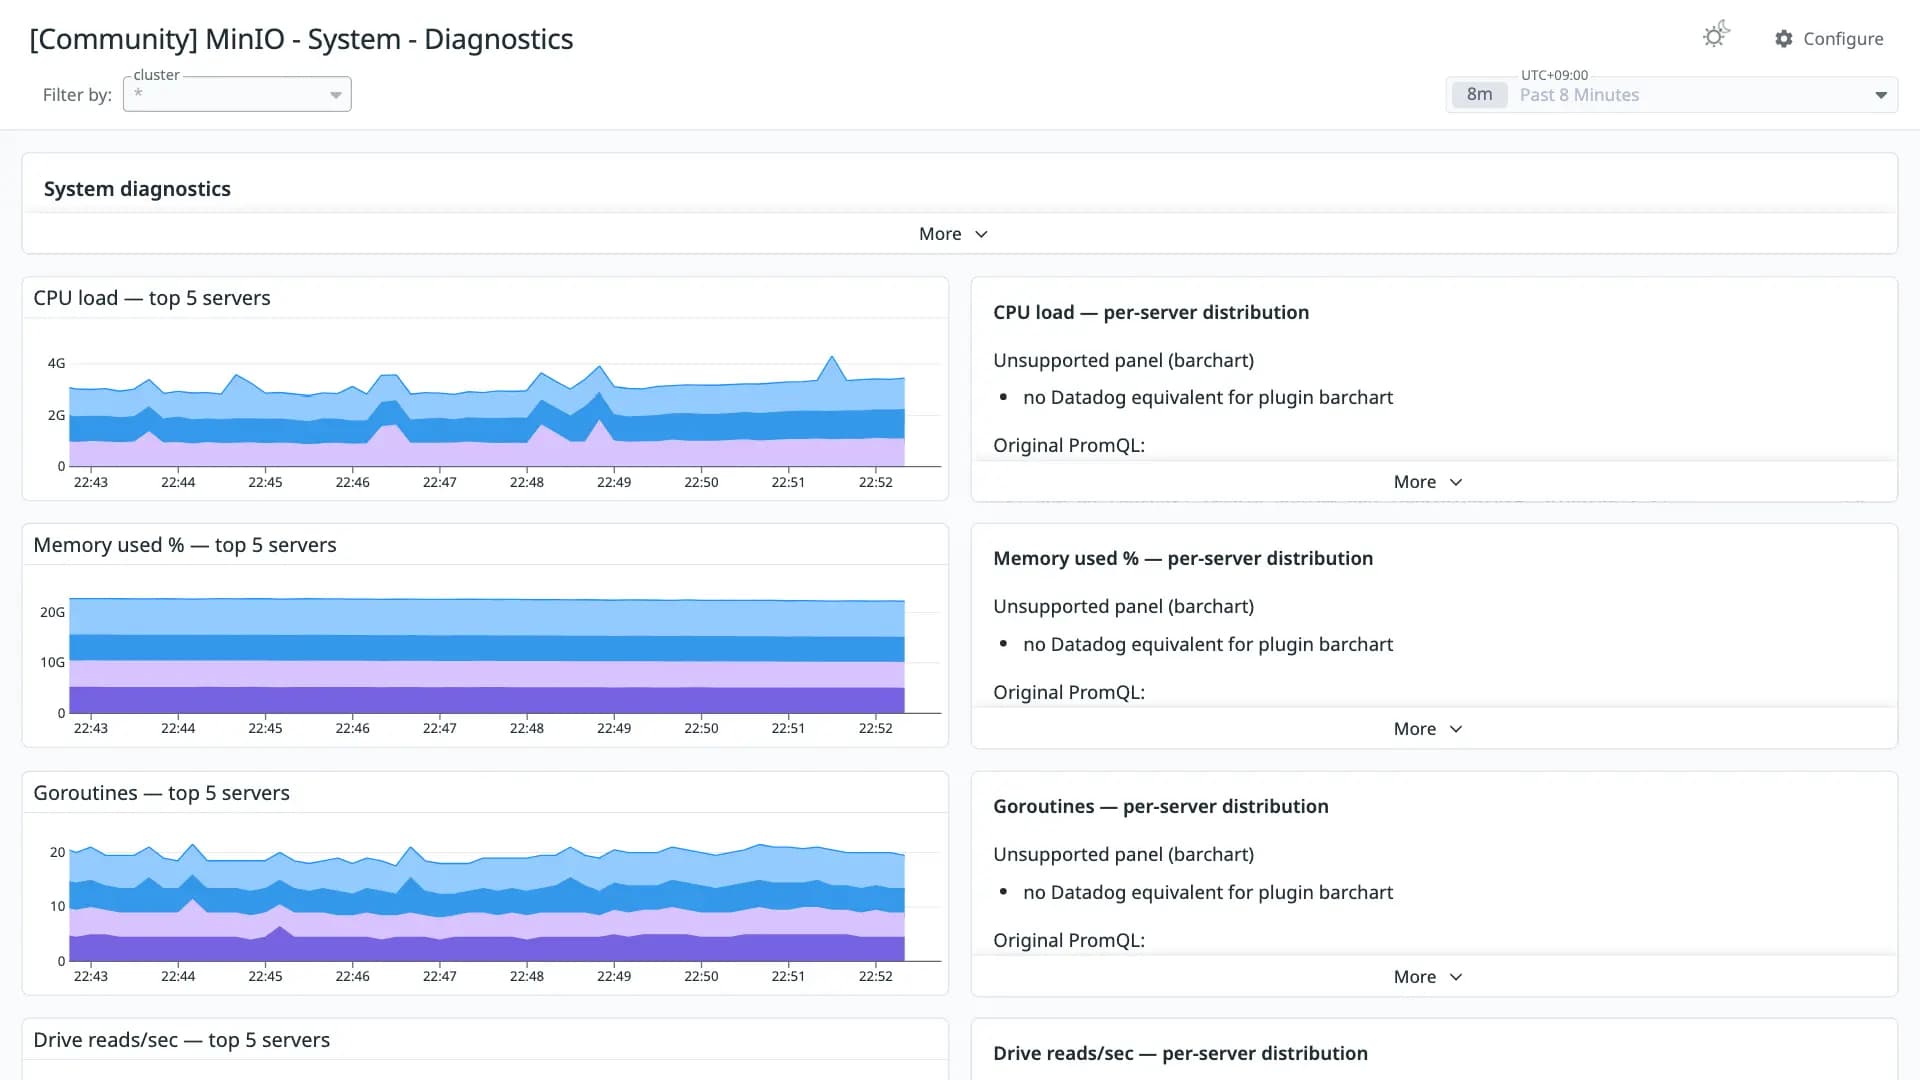
MinIO AIStor — System diagnostics. Top-5 timeseries paired with per-server distribution barcharts for CPU, memory, goroutines, drive throughput, and internode network. Use this dashboard when the operational system/* dashboards report cluster-wide pressure and you need to find which servers are responsible.
Conversion quality
Fair 65Share of panels whose queries were translated without loss. Partial and unsupported panels keep the original PromQL in a note widget.
- Native2
- OpenMetrics15
- Partial0
- Unsupported9
Metrics without a native Datadog mapping
These metric names were kept in OpenMetrics naming. Adjust them if you collect with a native Datadog integration.
minio_system_memory_used_perc ×2minio_system_process_go_routine_total ×2minio_system_network_internode_errors_total ×2minio_system_network_internode_dial_errors_total ×2minio_system_cpu_loadminio_system_drive_reads_per_secminio_system_drive_writes_per_secminio_system_network_internode_recv_bytes_totalminio_system_network_internode_sent_bytes_totalminio_system_drive_availability_errors_totalminio_system_process_file_descriptor_open_totalminio_system_process_file_descriptor_limit_totalminio_api_requests_5xx_errors_totalminio_api_requests_traffic_received_bytesminio_api_requests_traffic_sent_bytesUnsupported panels
- CPU load — per-server distribution
barchart - Memory used % — per-server distribution
barchart - Goroutines — per-server distribution
barchart - Drive reads/sec — per-server distribution
barchart - Drive writes/sec — per-server distribution
barchart - Internode receive — per-server distribution
barchart - Internode send — per-server distribution
barchart - Drive availability errors — per-server distribution
barchart - File descriptor pressure — per-server distribution
barchart
Revisions
- Revision 1Converted from grafana.com revision 1Download JSON
Rate this dashboard
Sign in to rate.0 comments
No comments yet.