MinIO - Executive - Overview
Good 880 downloads0 views0 commentsRevision 1Created Converted from Grafana dashboard #25425 by MinIO, Inc
How to import
In Datadog: Dashboards → New Dashboard → ⚙ Configure → Import dashboard JSON → paste this JSON.
Reactions
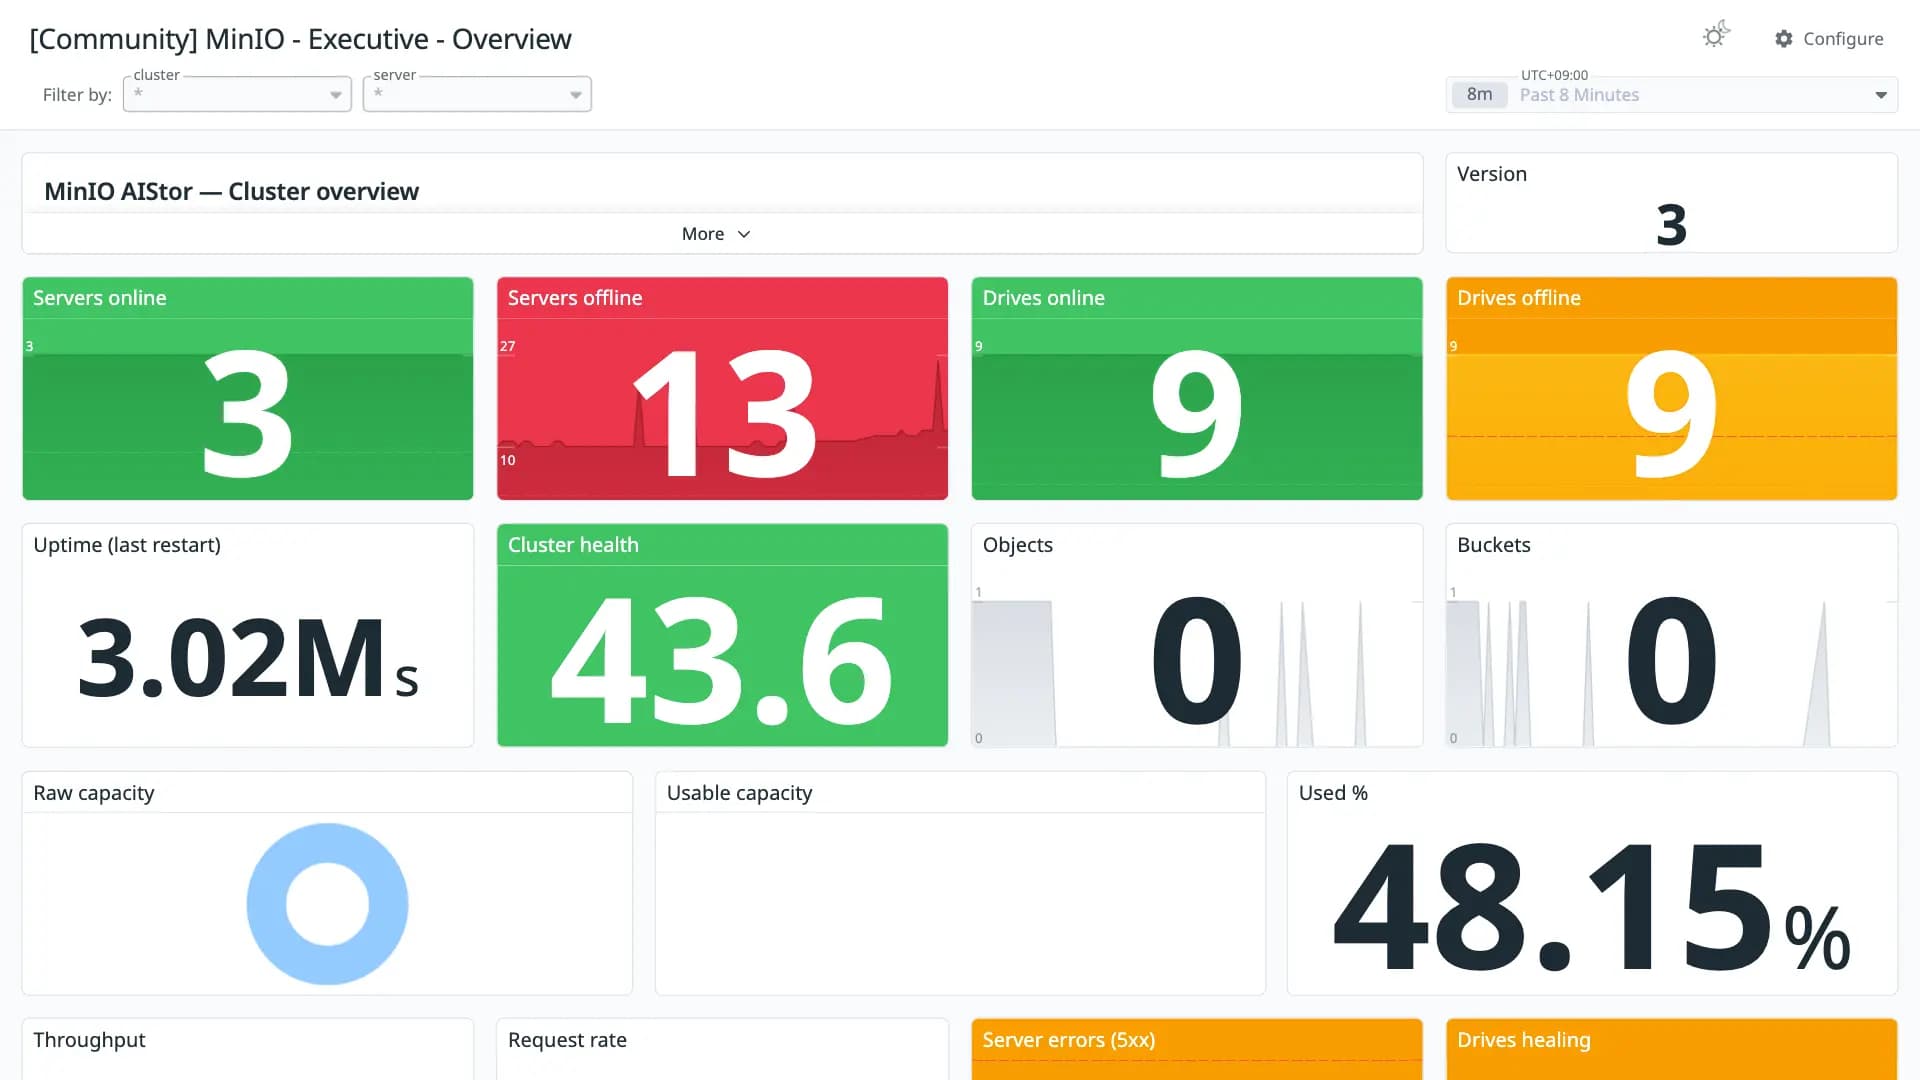
MinIO AIStor — Executive overview. Single-screen non-technical cluster health: headline server/drive KPIs, raw and usable capacity (pie charts + utilisation gauge), performance and error KPIs, TTFB latency distribution across six buckets, and trend timeseries for capacity / throughput / request rate / errors. Each stat tile carries a sparkline showing the last 12h trend.
Conversion quality
Good 88Share of panels whose queries were translated without loss. Partial and unsupported panels keep the original PromQL in a note widget.
- Native1
- OpenMetrics22
- Partial7
- Unsupported0
Metrics without a native Datadog mapping
These metric names were kept in OpenMetrics naming. Adjust them if you collect with a native Datadog integration.
minio_api_requests_ttfb_seconds_distribution ×6minio_system_drive_used_bytes ×3minio_system_process_uptime_seconds ×2minio_system_drive_health ×2minio_system_drive_free_bytes ×2minio_cluster_health_capacity_usable_free_bytes ×2minio_api_requests_traffic_received_bytes ×2minio_api_requests_traffic_sent_bytes ×2minio_api_requests_total ×2minio_api_requests_5xx_errors_total ×2minio_software_version_infominio_cluster_health_nodes_offline_countminio_cluster_erasure_set_overall_healthminio_cluster_usage_objects_countminio_cluster_usage_objects_buckets_countminio_cluster_health_capacity_usable_total_bytesminio_cluster_erasure_set_healing_drives_countminio_scanner_last_activity_secondsminio_cluster_usage_objects_size_distributionminio_cluster_usage_objects_total_bytesminio_api_requests_4xx_errors_totalRevisions
- Revision 1Converted from grafana.com revision 1Download JSON
Rate this dashboard
Sign in to rate.0 comments
No comments yet.