MetalLB — L2 Mode
Good 900 downloads0 views0 commentsRevision 1Created Converted from Grafana dashboard #25519 by stoutelephant858
How to import
In Datadog: Dashboards → New Dashboard → ⚙ Configure → Import dashboard JSON → paste this JSON.
Reactions
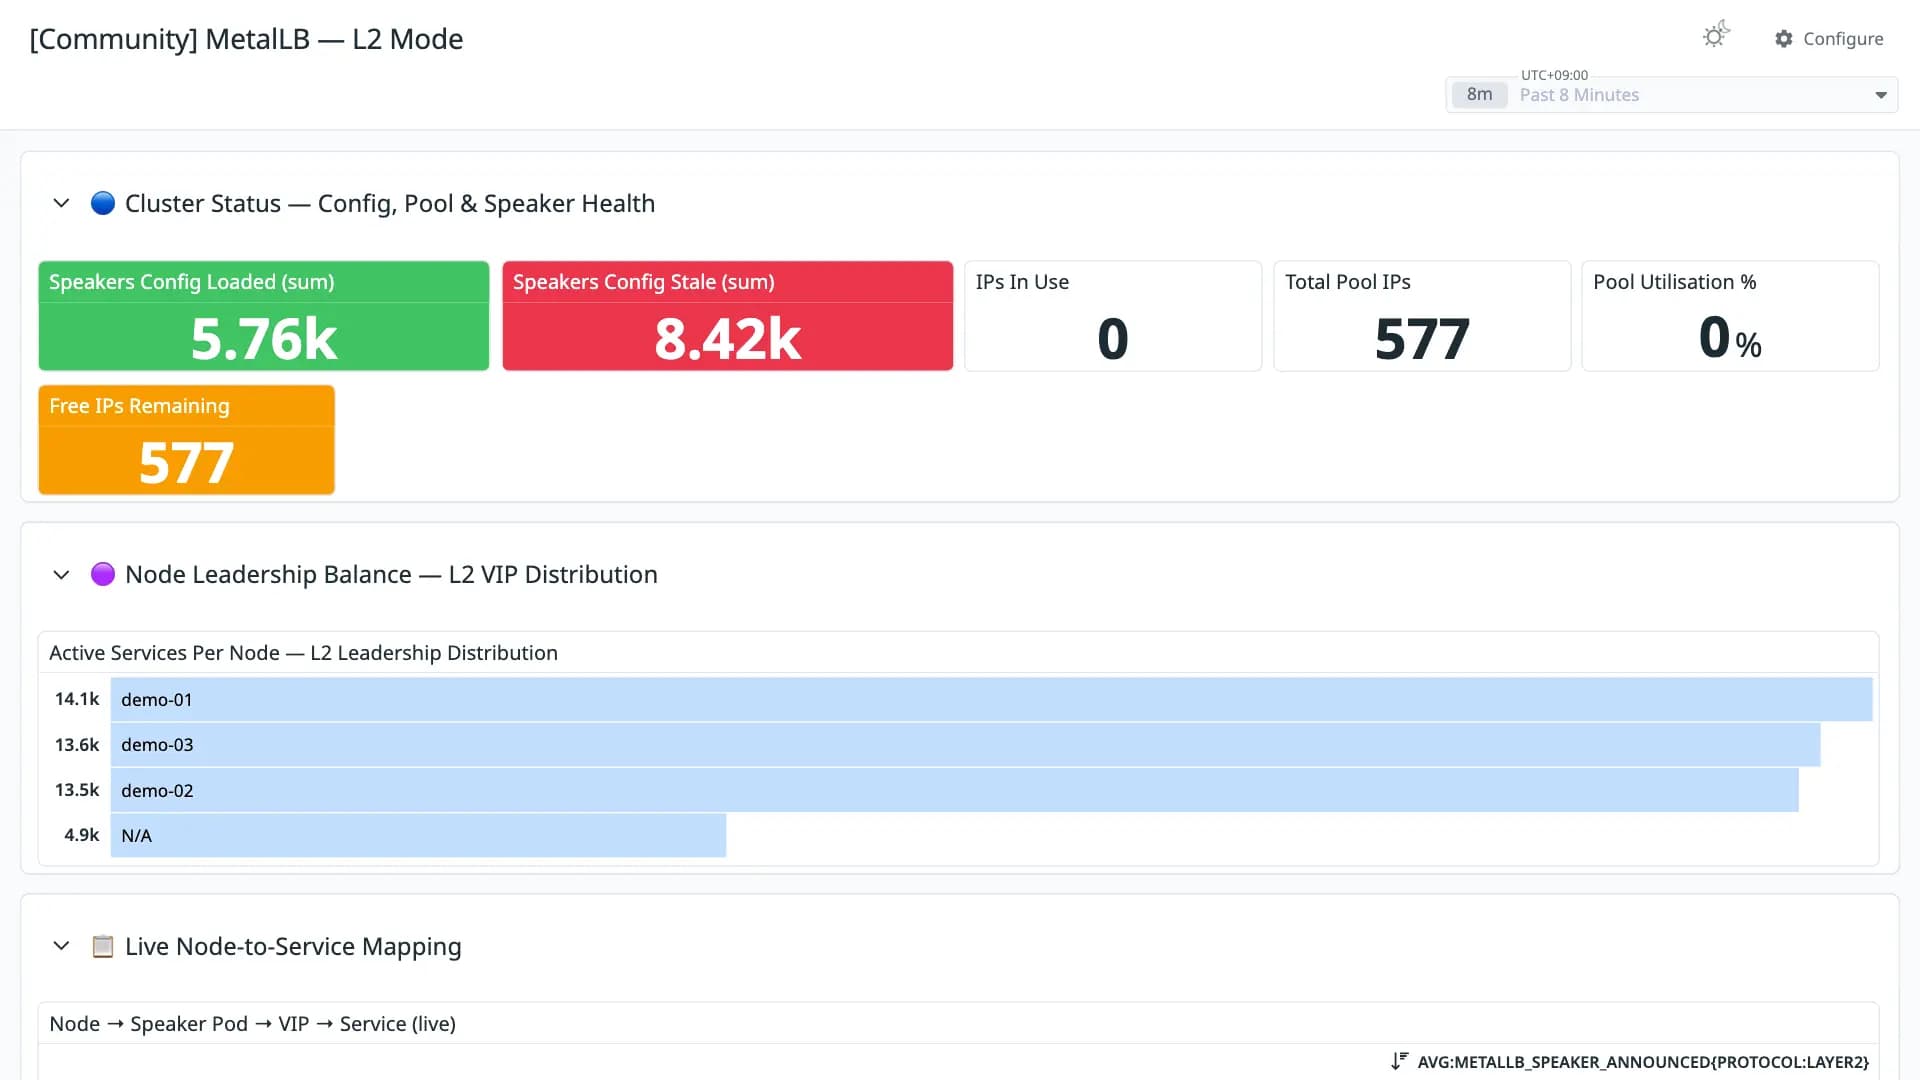
MetalLB L2 Mode — controller pool metrics + speaker ARP/NDP health, VIP-to-node ownership, failover severity ranking. Scaled for large (15+ node) clusters.
Conversion quality
Good 90Share of panels whose queries were translated without loss. Partial and unsupported panels keep the original PromQL in a note widget.
- Native0
- OpenMetrics13
- Partial1
- Unsupported1
Metrics without a native Datadog mapping
These metric names were kept in OpenMetrics naming. Adjust them if you collect with a native Datadog integration.
metallb_allocator_addresses_in_use_total ×3metallb_allocator_addresses_total ×3metallb_layer2_gratuitous_sent ×3metallb_speaker_announced ×2metallb_layer2_requests_received ×2metallb_layer2_responses_sent ×2metallb_k8s_client_config_loaded_boolmetallb_k8s_client_config_stale_boolkube_pod_infoUnsupported panels
- Gratuitous / Requests Ratio % (traffic-gated) — gaps = too quiet to judge, line >50% = real instability
timeseries
Revisions
- Revision 1Converted from grafana.com revision 1Download JSON
Rate this dashboard
Sign in to rate.0 comments
No comments yet.