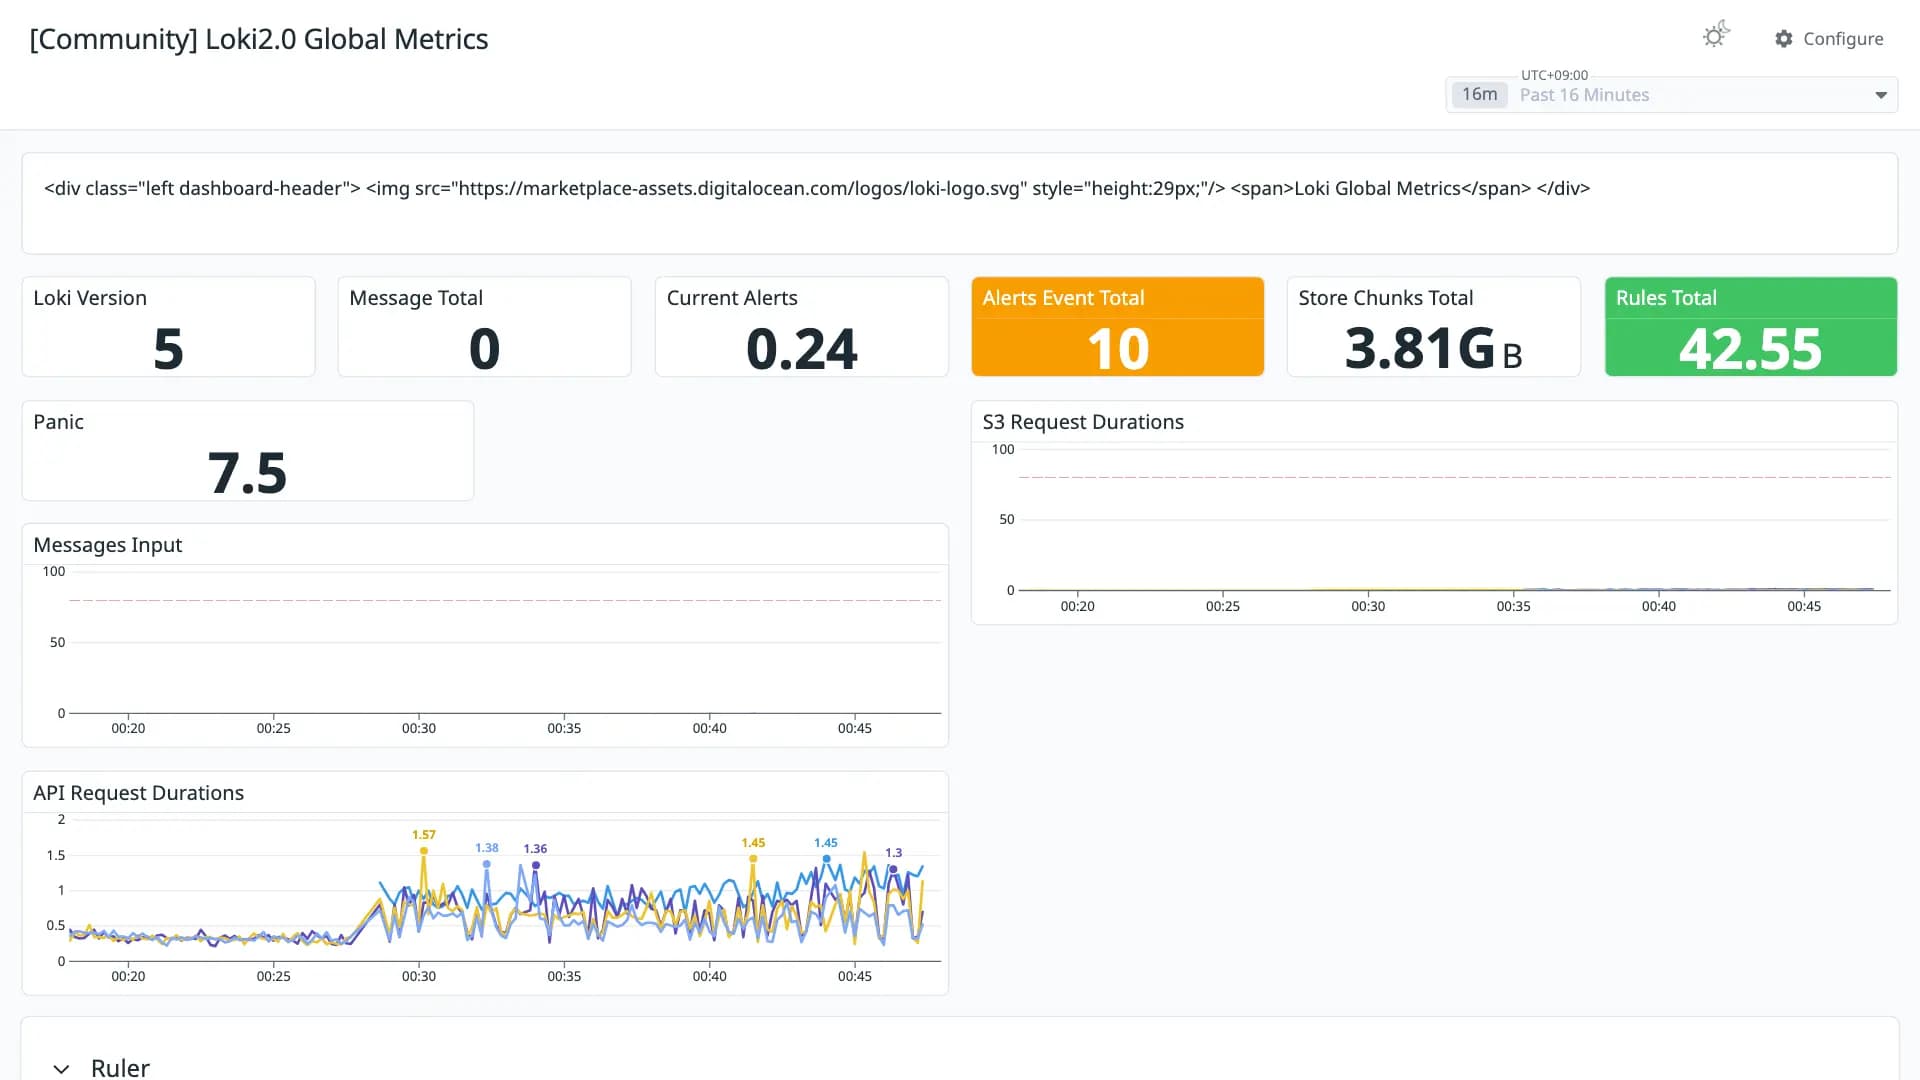
Loki2.0 Global Metrics
Good 800 downloads0 views0 commentsRevision 1Created Converted from Grafana dashboard #19772 by wellingtonbastos
How to import
In Datadog: Dashboards → New Dashboard → ⚙ Configure → Import dashboard JSON → paste this JSON.
Reactions
Loki metrics via 2.0
Conversion quality
Good 80Share of panels whose queries were translated without loss. Partial and unsupported panels keep the original PromQL in a note widget.
- Native1
- OpenMetrics19
- Partial13
- Unsupported0
Metrics without a native Datadog mapping
These metric names were kept in OpenMetrics naming. Adjust them if you collect with a native Datadog integration.
loki_log_messages_total ×2prometheus_notifications_sent_total ×2loki_request_duration_seconds_bucket ×2loki_build_infoprometheus_notifications_alertmanagers_discoveredloki_ingester_chunk_stored_bytes_totalprometheus_rule_group_rulesloki_panic_totalprometheus_rule_evaluations_totalprometheus_notifications_latency_secondsprometheus_rule_evaluation_duration_secondsloki_cache_request_duration_seconds_bucketloki_cache_value_size_bytes_bucketloki_cache_hitsloki_cache_background_queue_lengthloki_cache_fetched_keysloki_chunk_store_chunks_per_query_bucketloki_distributor_lines_received_totalloki_distributor_bytes_received_totalloki_distributor_ingester_appends_totalloki_distributor_ingester_append_failures_totalloki_ingester_blocks_per_chunk_bucketloki_ingester_chunk_size_bytes_bucketloki_ingester_chunk_age_seconds_bucketloki_ingester_chunk_compression_ratio_bucketloki_ingester_chunk_encode_time_seconds_bucketloki_ingester_chunk_entries_bucketloki_ingester_chunks_created_totalloki_ingester_chunks_flushed_totalloki_ingester_chunks_stored_totalloki_ingester_memory_chunksloki_ingester_memory_streamsloki_ingester_streams_created_totalloki_ingester_streams_removed_totalTagsloki
Revisions
- Revision 1Converted from grafana.com revision 1Download JSON
Rate this dashboard
Sign in to rate.0 comments
No comments yet.