Loki stack monitoring (Promtail, Loki)
Fair 780 downloads0 views0 commentsRevision 1Created Converted from Grafana dashboard #18892 by malmuaikel1
How to import
In Datadog: Dashboards → New Dashboard → ⚙ Configure → Import dashboard JSON → paste this JSON.
Reactions
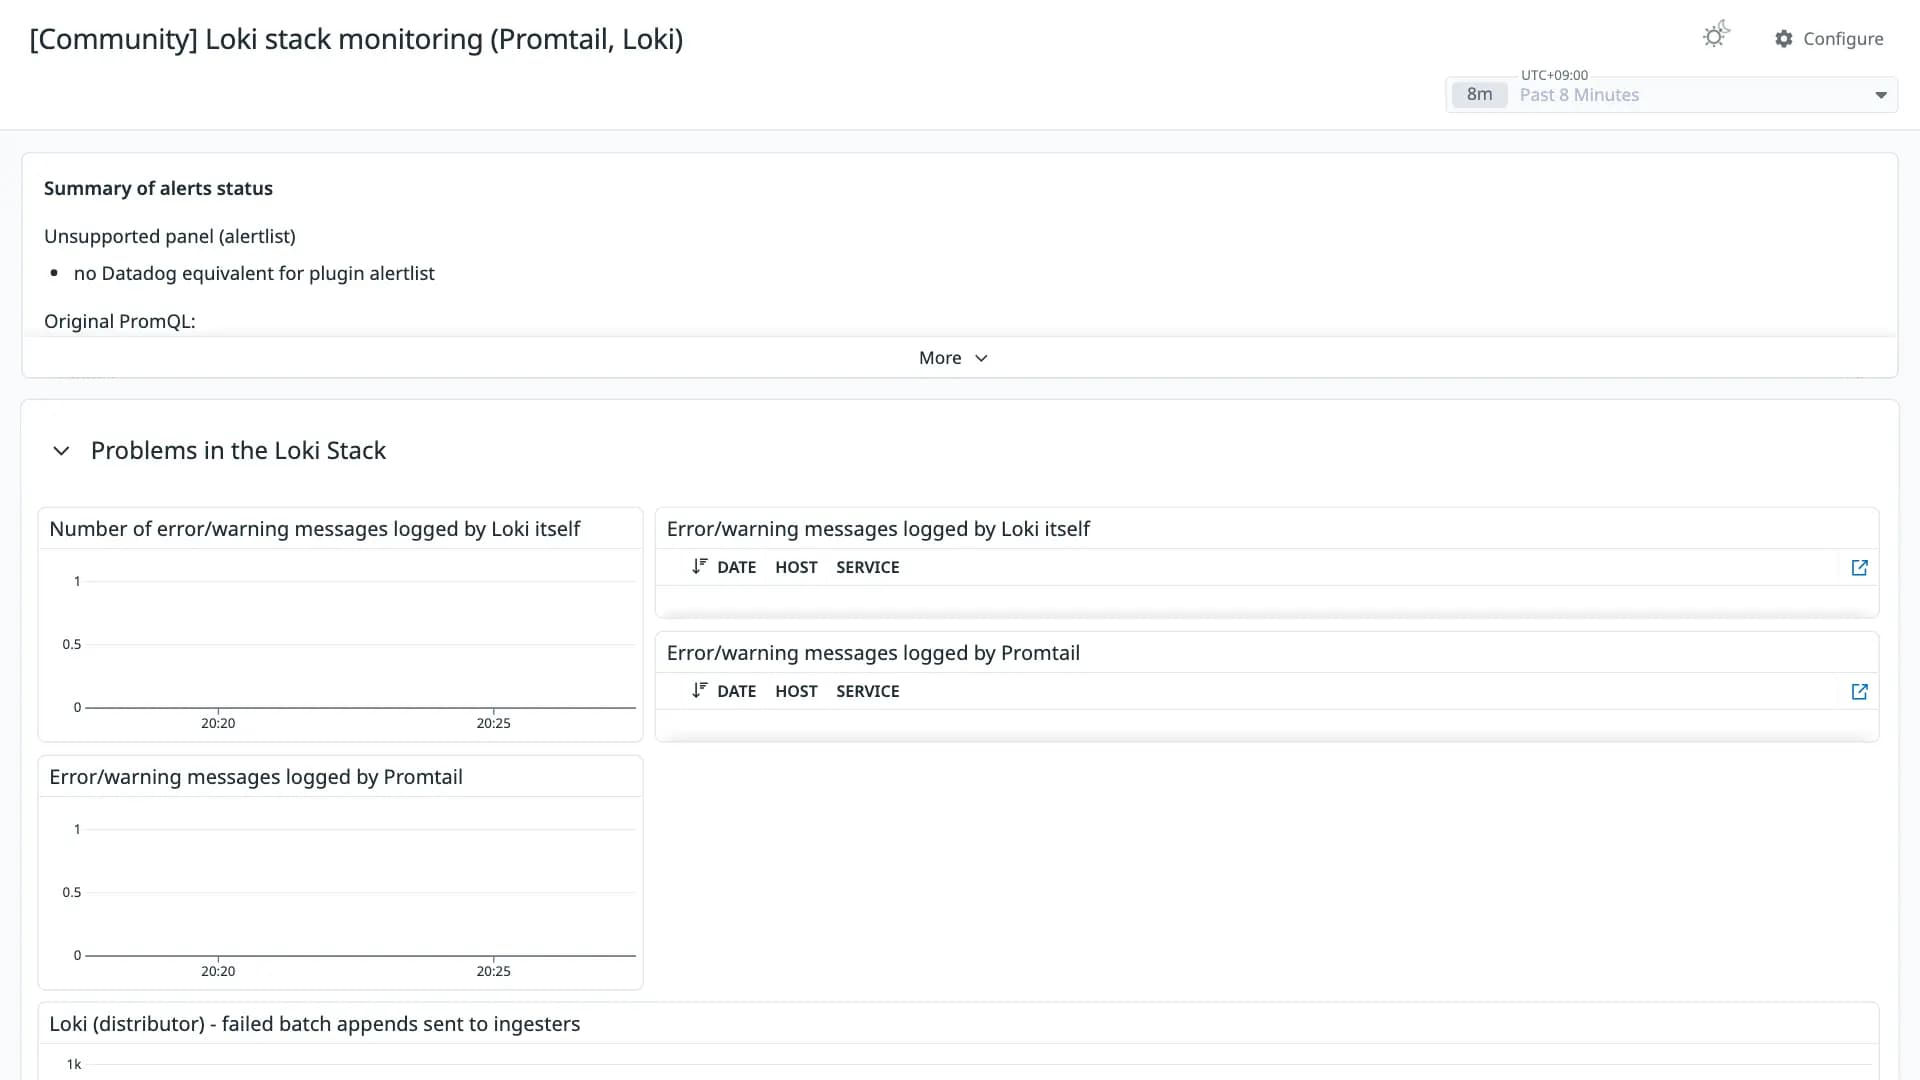
This dashboard can be used to detect issues on the Loki stack, when deployed in Kubernetes. Shows: some error metrics published by Promtail/Loki. Error and warning logs emitted by Promtail/Loki. Memory and CPU usage of Promtail/Loki compared against the Kubernetes memory/cpu limits and requests.
Conversion quality
Fair 78Share of panels whose queries were translated without loss. Partial and unsupported panels keep the original PromQL in a note widget.
- Native4
- OpenMetrics7
- Partial6
- Unsupported1
Metrics without a native Datadog mapping
These metric names were kept in OpenMetrics naming. Adjust them if you collect with a native Datadog integration.
log_messages_total ×2loki_distributor_ingester_append_failures_totalpromtail_dropped_entries_totalloki_ingester_memory_streamsloki_distributor_lines_received_totalloki_distributor_bytes_received_totalUnsupported panels
- Summary of alerts status
alertlist
Revisions
- Revision 1Converted from grafana.com revision 1Download JSON
Rate this dashboard
Sign in to rate.0 comments
No comments yet.