LLM Simulation - vLLM Serving Overview
Good 920 downloads0 views0 commentsRevision 1Created Converted from Grafana dashboard #25620 by ChrisAdkin
How to import
In Datadog: Dashboards → New Dashboard → ⚙ Configure → Import dashboard JSON → paste this JSON.
Reactions
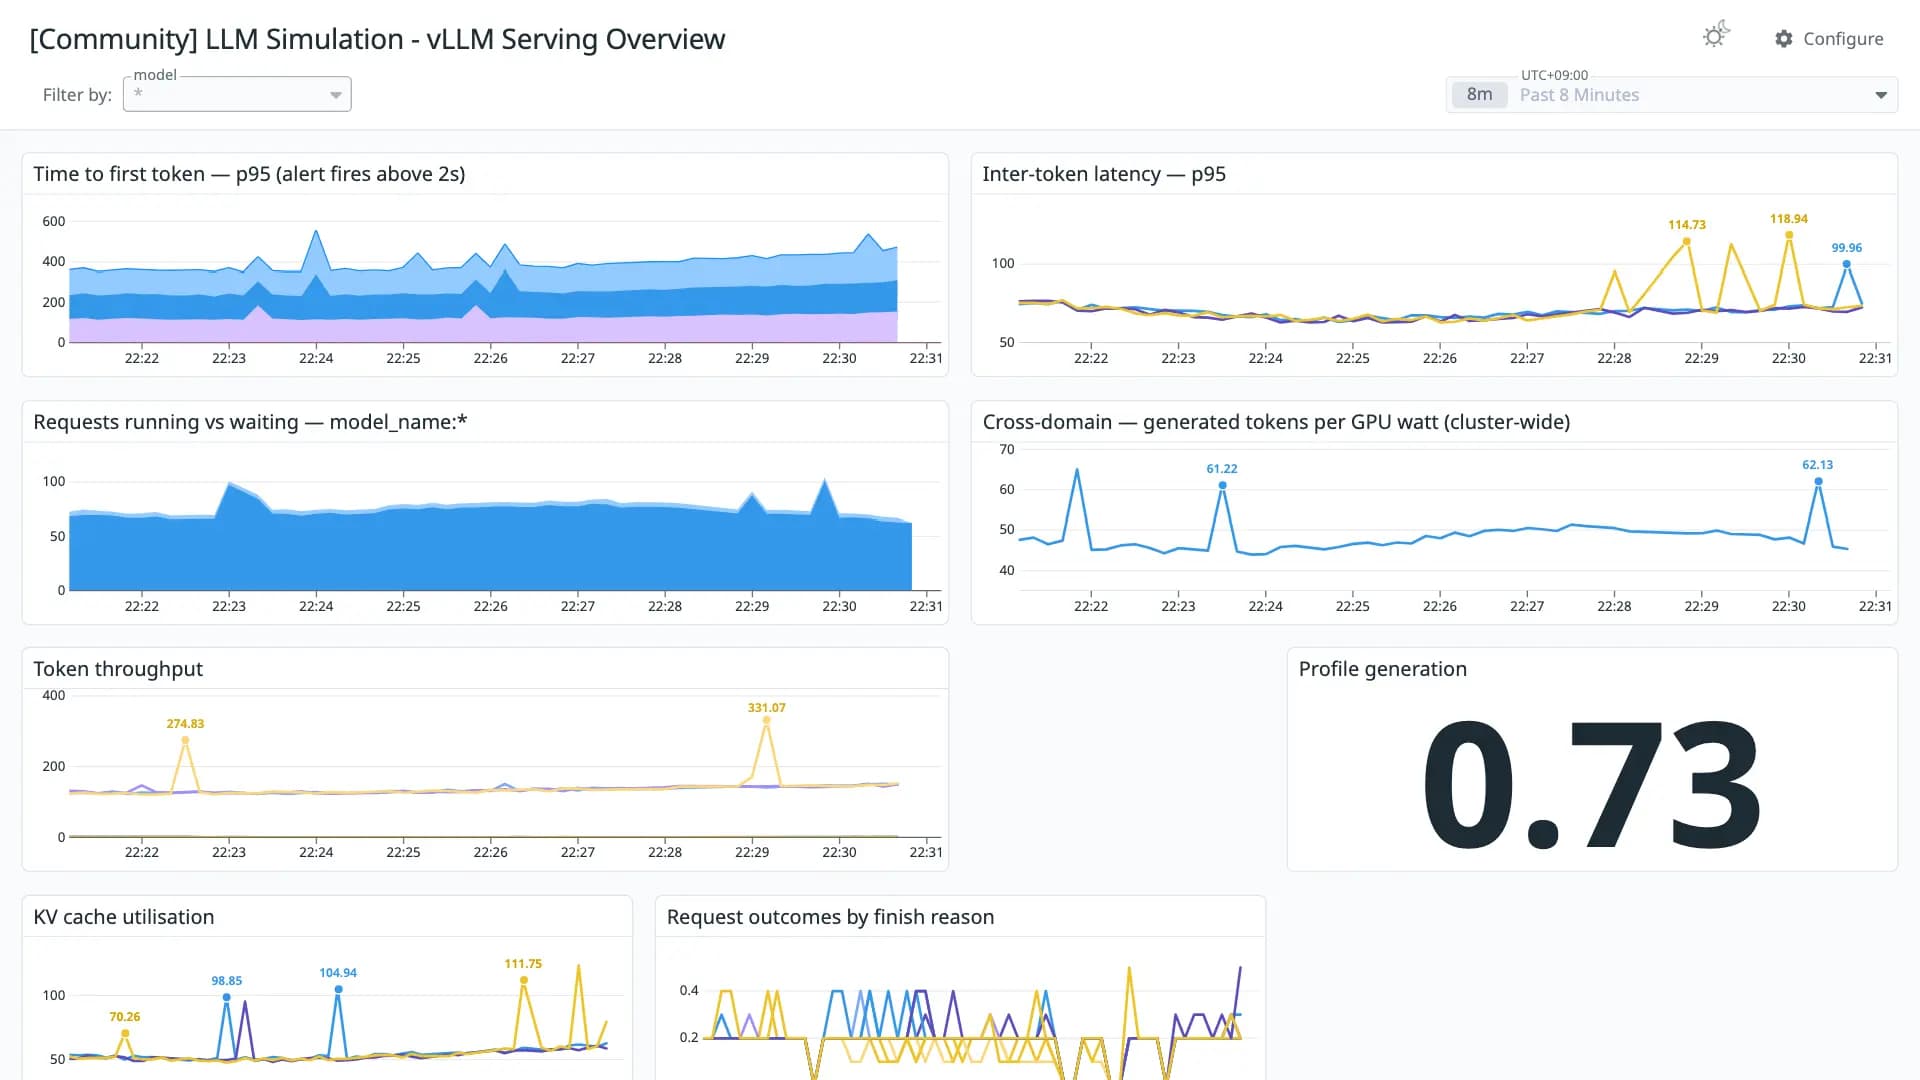
vLLM serving overview: first-token and inter-token latency, throughput, queue depth, KV cache, prefix-cache reuse and a TTFT error budget, every panel by (model_name). V1 metric names; several panels need the llm:* recording rules.
Conversion quality
Good 92Share of panels whose queries were translated without loss. Partial and unsupported panels keep the original PromQL in a note widget.
- Native0
- OpenMetrics12
- Partial0
- Unsupported1
Metrics without a native Datadog mapping
These metric names were kept in OpenMetrics naming. Adjust them if you collect with a native Datadog integration.
llm:ttft:p95_5mllm:tpot:p95_5mvllm:num_requests_runningvllm:num_requests_waitingllm:tokens:generation_rate5mllm:tokens:prompt_rate5mllm:tokens_per_watt:5mvllm:kv_cache_usage_percvllm:request_success_totalllmsim_requests_rejected_totalllmsim_profile_generationllm:prefix_cache:hit_ratio5mllm:ttft:slo_ratio1hllm:queue:mean5mllm:prefill:mean5mllm:decode:mean5mllm:e2e:mean5mllm:decode:p95_5mUnsupported panels
- Simulated GPU attribution
table
Integrationsvllm_request_success
Revisions
- Revision 1Converted from grafana.com revision 3Download JSON
Rate this dashboard
Sign in to rate.0 comments
No comments yet.