LLM Inference Dashboard (SGLang / vLLM)
Good 830 downloads0 views0 commentsRevision 1Created Converted from Grafana dashboard #25502 by patientflounder2051
How to import
In Datadog: Dashboards → New Dashboard → ⚙ Configure → Import dashboard JSON → paste this JSON.
Reactions
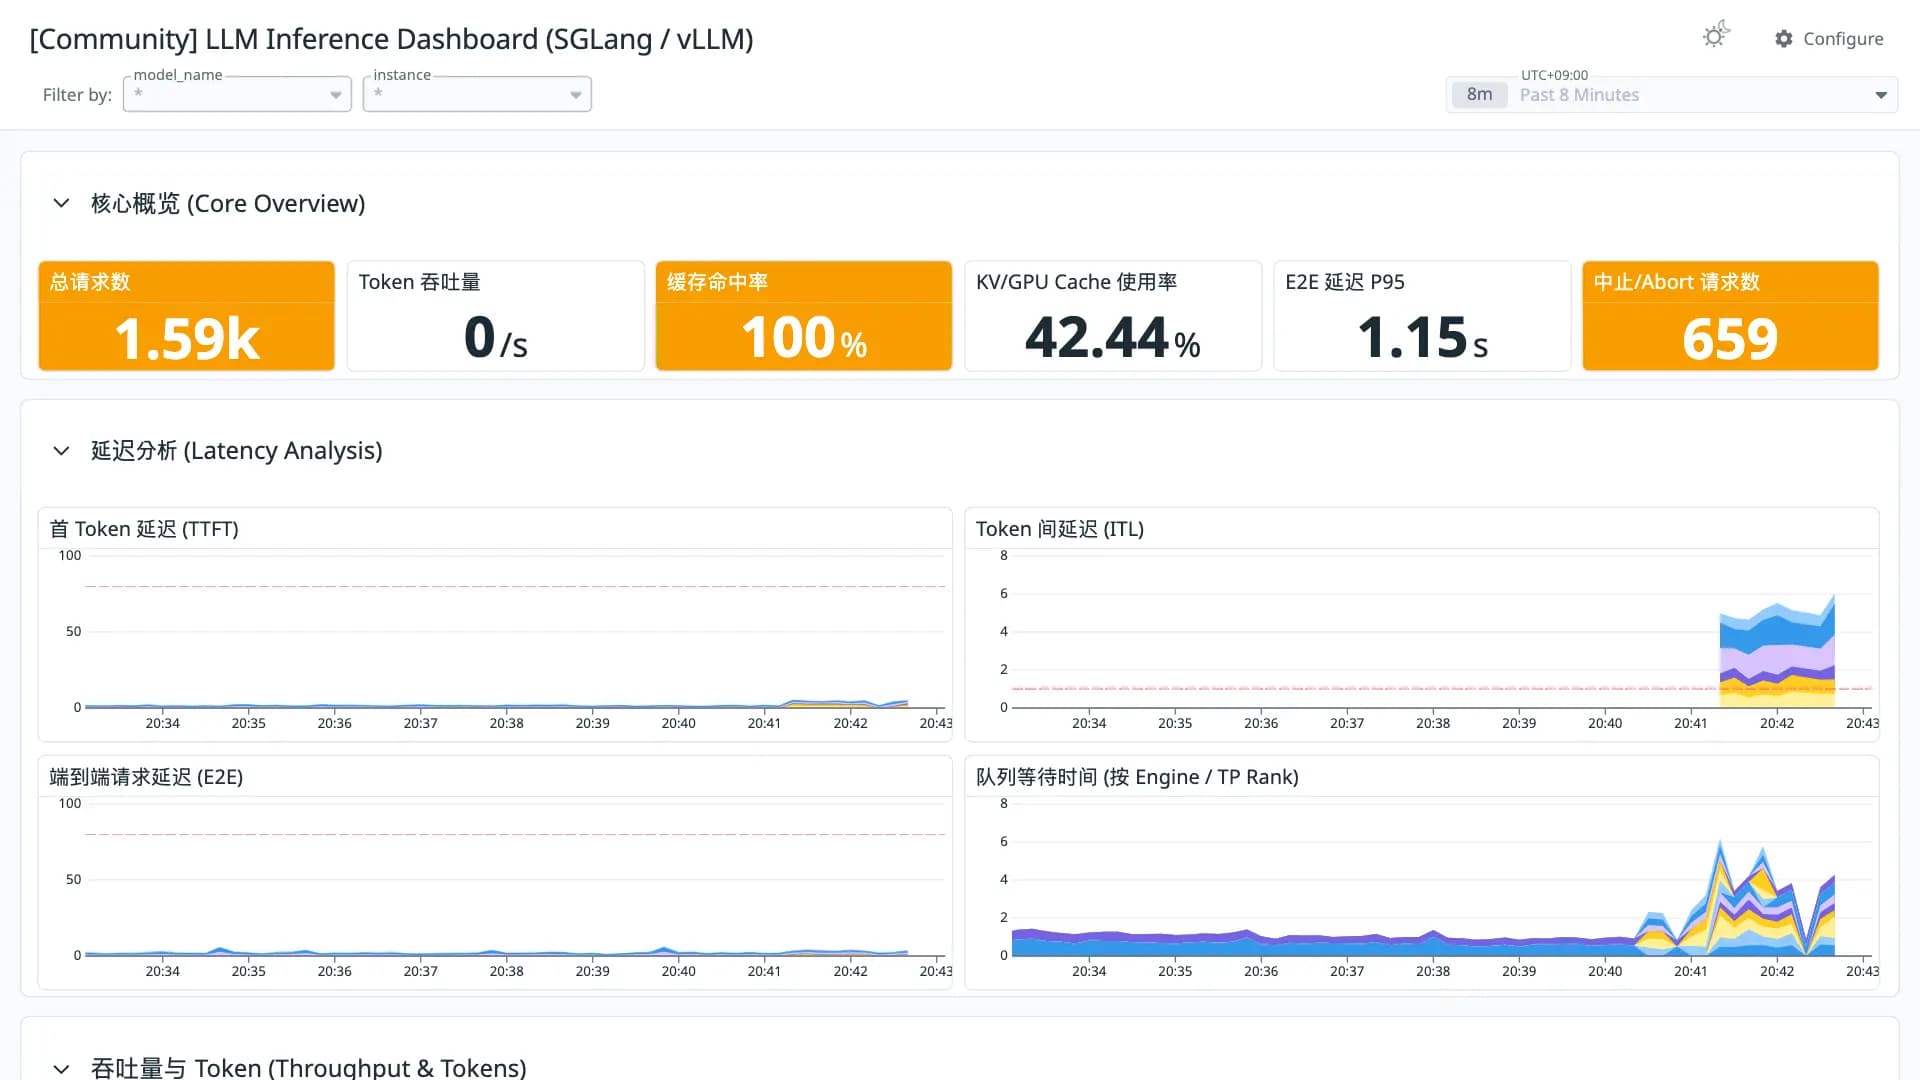
同时支持 SGLang 和 vLLM 的统一 LLM 推理监控 Grafana Dashboard,数据源为 Prometheus。该模板将两类推理后端的可比指标放在同一视图中展示,覆盖请求量、Token 吞吐、延迟分位数、队列状态、缓存行为以及 Engine 或 TP Rank 维度的分布情况。适用于混合推理集群、后端迁移、压测对比和统一运维场景,帮助团队用一致的视角观察不同推理框架的服务表现。
Conversion quality
Good 83Share of panels whose queries were translated without loss. Partial and unsupported panels keep the original PromQL in a note widget.
- Native0
- OpenMetrics16
- Partial8
- Unsupported0
Metrics without a native Datadog mapping
These metric names were kept in OpenMetrics naming. Adjust them if you collect with a native Datadog integration.
vllm:e2e_request_latency_seconds_bucket ×5sglang:e2e_request_latency_seconds_bucket ×5vllm:generation_tokens_total ×4vllm:prompt_tokens_total ×4sglang:realtime_tokens_total ×4vllm:time_to_first_token_seconds_bucket ×3sglang:time_to_first_token_seconds_bucket ×3vllm:inter_token_latency_seconds_bucket ×3sglang:inter_token_latency_seconds_bucket ×3vllm:request_success_total ×2vllm:prefix_cache_hits_total ×2vllm:prefix_cache_queries_total ×2vllm:request_queue_time_seconds_bucket ×2sglang:queue_time_seconds_bucket ×2sglang:process_cpu_seconds_total ×2vllm:kv_block_idle_before_evict_seconds_bucket ×2sglang:eviction_duration_seconds_bucket ×2sglang:num_requests_totalsglang:generation_tokens_totalsglang:prompt_tokens_totalsglang:cache_hit_ratevllm:kv_cache_usage_percsglang:utilizationsglang:num_aborted_requests_totalvllm:prompt_tokens_cached_totalsglang:cached_tokens_totalsglang:evicted_tokens_totalvllm:iteration_tokens_total_bucketsglang:cuda_graph_passes_totalvllm:num_requests_runningsglang:num_running_reqsvllm:num_requests_waitingsglang:num_queue_reqsvllm:request_params_max_tokens_sumvllm:request_params_max_tokens_countsglang:max_total_num_tokensvllm:request_prefill_kv_computed_tokens_sumvllm:request_prompt_tokens_sumsglang:new_token_ratiovllm:request_prefill_time_seconds_sumvllm:request_decode_time_seconds_sumvllm:request_prefill_time_seconds_bucketsglang:per_stage_req_latency_seconds_bucketvllm:request_queue_time_seconds_sumvllm:request_queue_time_seconds_countsglang:queue_time_seconds_sumsglang:queue_time_seconds_countRevisions
- Revision 1Converted from grafana.com revision 1Download JSON
Rate this dashboard
Sign in to rate.0 comments
No comments yet.