Linkerd HAZL: Multi-Zone Traffic & Cost Analysis
가져오는 방법
Datadog에서 Dashboards → New Dashboard → ⚙ Configure → Import dashboard JSON 순으로 이동한 뒤 이 JSON을 붙여넣으세요.
반응
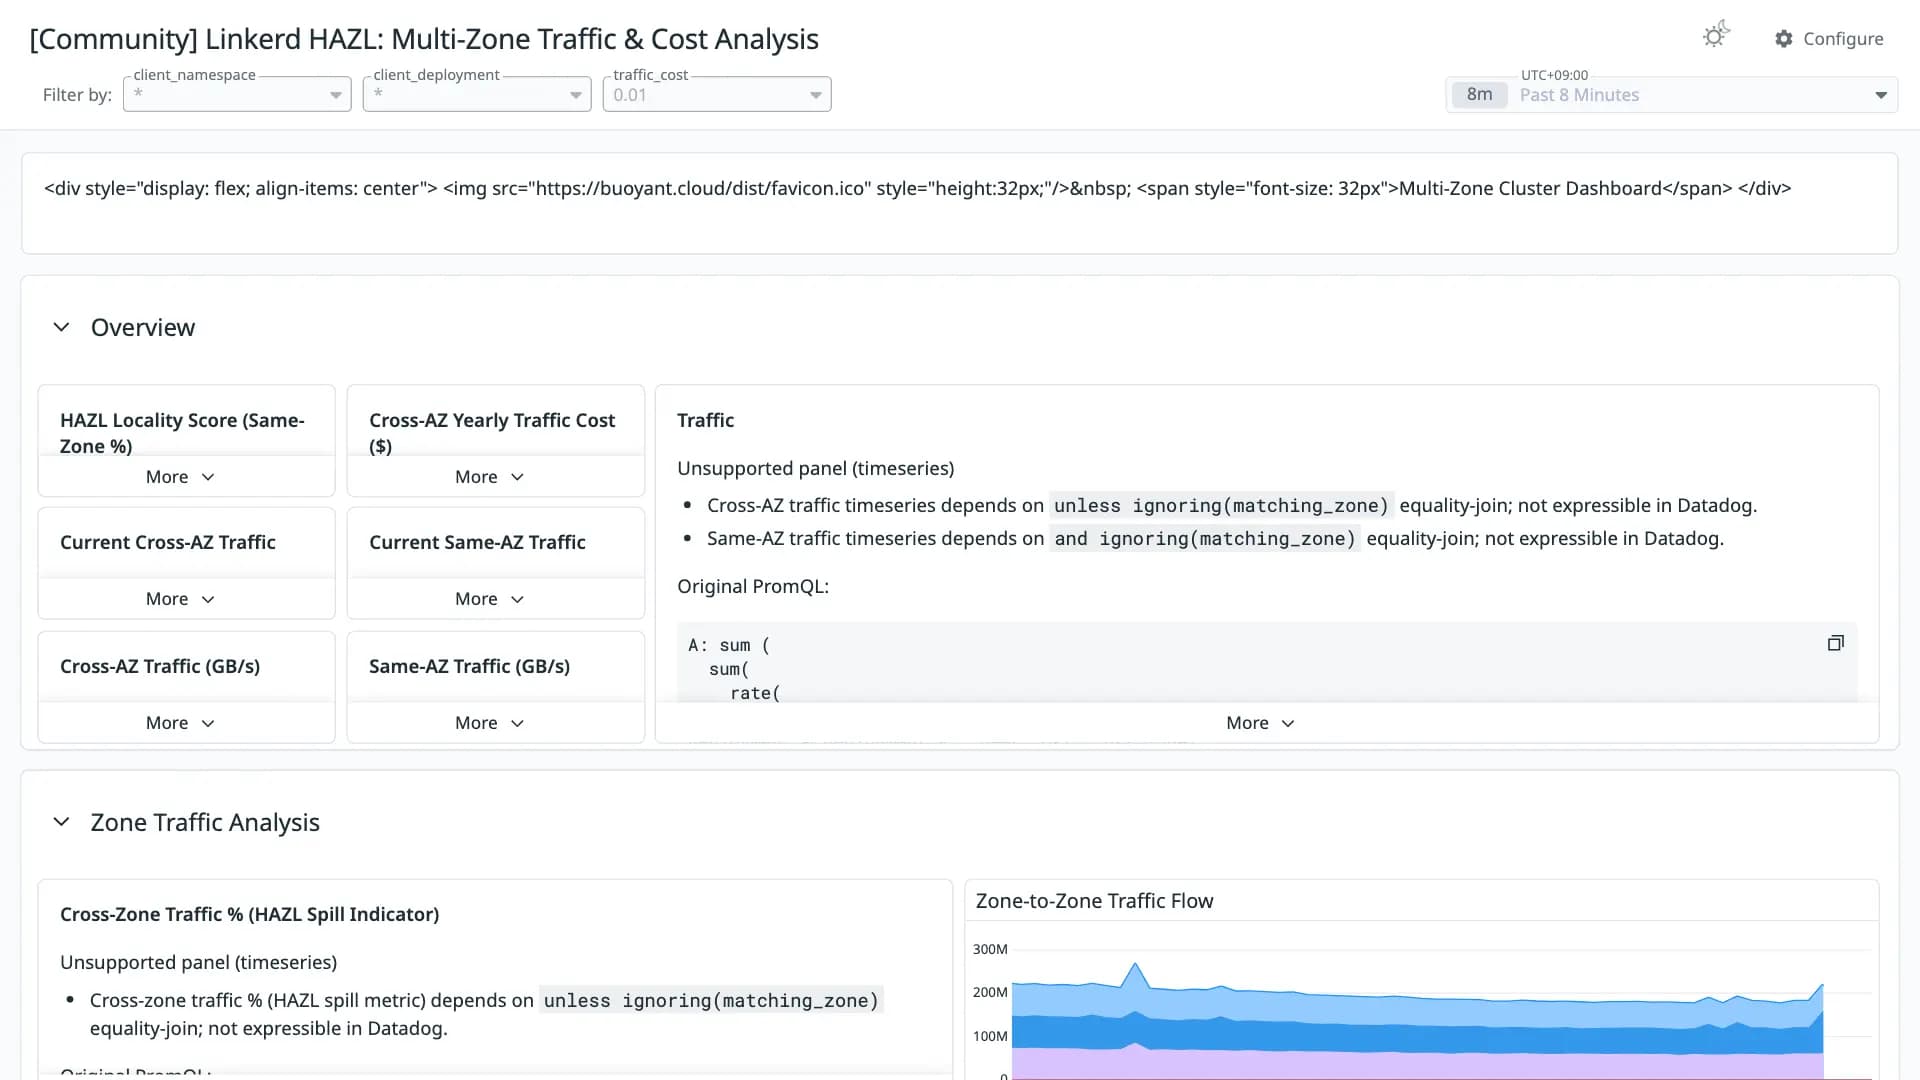
Comprehensive visibility into Linkerd's High Availability Zone-aware Load balancing (HAZL) across multi-zone Kubernetes clusters. Tracks same-zone locality scores, cross-AZ traffic volume and projected cost savings, zone-to-zone traffic flow, endpoint pool health, inbound/outbound latency by zone, and HAZL tuning guidance. Use to validate HAZL effectiveness, identify zone imbalances, and quantify egress cost reduction.
변환 품질
보통 52쿼리가 손실 없이 변환된 패널의 비율입니다. 일부만 변환됐거나 지원되지 않는 패널은 원본 PromQL을 노트 위젯에 그대로 남겨 둡니다.
- 기본 통합3
- OpenMetrics14
- 일부 변환10
- 미지원15
Datadog 기본 통합 메트릭으로 매핑되지 않은 항목
OpenMetrics 이름을 그대로 사용한 메트릭입니다. Datadog 기본 통합으로 수집 중이라면 메트릭 이름을 맞춰 주세요.
outbound_http_balancer_p2c_endpoints ×8outbound_http_balancer_adaptive_endpoints ×8response_total ×6tcp_write_bytes_total ×5tcp_read_bytes_total ×5response_latency_ms_bucket ×3tcp_open_connectionstcp_open_totaltcp_close_total지원되지 않는 패널
- HAZL Locality Score (Same-Zone %)
stat - Cross-AZ Yearly Traffic Cost ($)
stat - Traffic
timeseries - Current Cross-AZ Traffic
stat - Current Same-AZ Traffic
stat - Cross-AZ Traffic (GB/s)
stat - Same-AZ Traffic (GB/s)
stat - Cross-Zone Traffic % (HAZL Spill Indicator)
timeseries - Actual Cross-AZ Annual Cost (With HAZL)
stat - HAZL Annual Savings ($)
stat - HAZL Cross-AZ Traffic Reduction (%)
stat - Annualized Cost: HAZL vs No-HAZL Baseline
timeseries - Pod Count per Zone (selected namespace)
barchart - Zone Imbalance Ratio (max/min pods)
stat - Structural Cross-Zone Spill (from skew alone)
stat
리비전 이력
- 리비전 1Converted from grafana.com revision 2JSON 다운로드
이 대시보드 평가하기
평가하려면 로그인이 필요합니다.댓글 0개
아직 댓글이 없습니다.