Linkerd HAZL 대시보드
Fair 520 downloads0 views0 commentsRevision 1Created Converted from Grafana dashboard #23774 by gtrekter
How to import
In Datadog: Dashboards → New Dashboard → ⚙ Configure → Import dashboard JSON → paste this JSON.
Reactions
Conversion quality
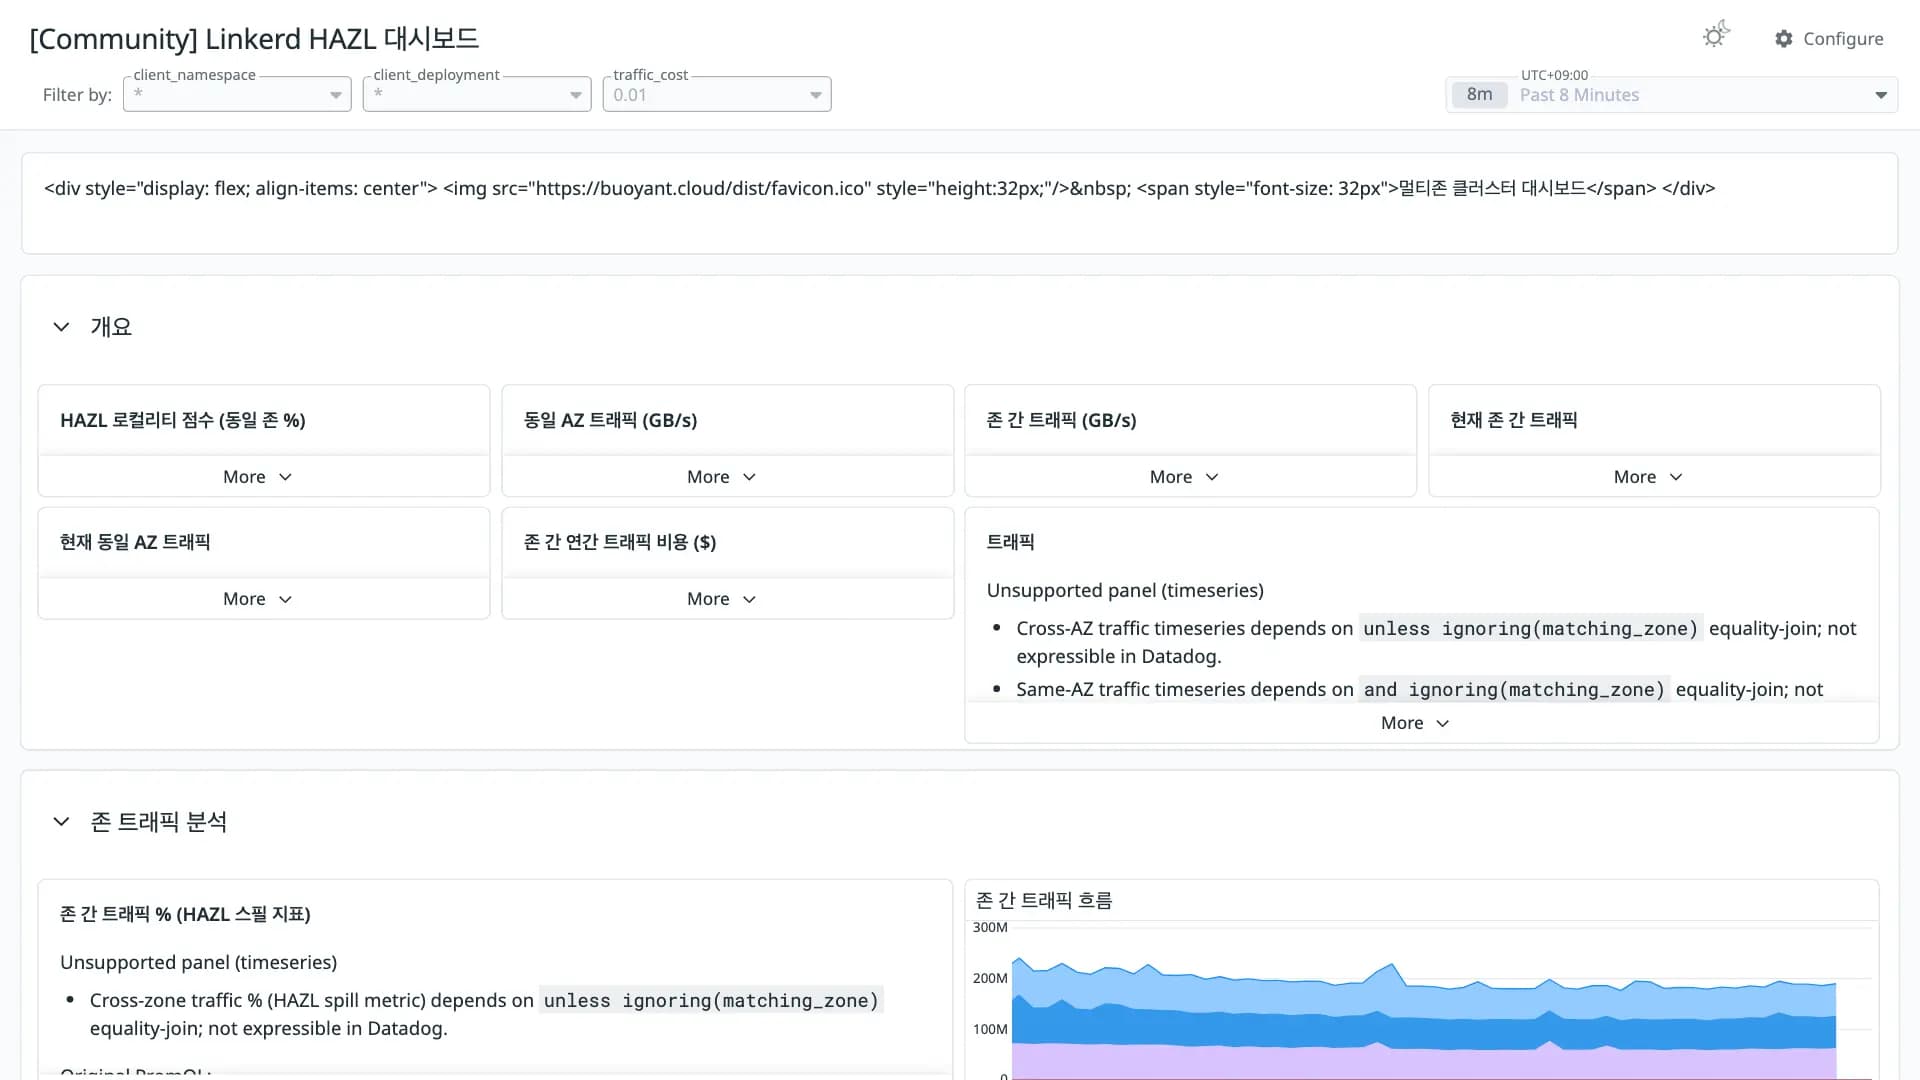
Fair 52Share of panels whose queries were translated without loss. Partial and unsupported panels keep the original PromQL in a note widget.
- Native3
- OpenMetrics14
- Partial10
- Unsupported15
Metrics without a native Datadog mapping
These metric names were kept in OpenMetrics naming. Adjust them if you collect with a native Datadog integration.
outbound_http_balancer_p2c_endpoints ×8outbound_http_balancer_adaptive_endpoints ×8response_total ×6tcp_write_bytes_total ×5tcp_read_bytes_total ×5response_latency_ms_bucket ×3tcp_open_connectionstcp_open_totaltcp_close_totalUnsupported panels
- HAZL 로컬리티 점수 (동일 존 %)
stat - 동일 AZ 트래픽 (GB/s)
stat - 존 간 트래픽 (GB/s)
stat - 현재 존 간 트래픽
stat - 현재 동일 AZ 트래픽
stat - 존 간 연간 트래픽 비용 ($)
stat - 트래픽
timeseries - 존 간 트래픽 % (HAZL 스필 지표)
timeseries - 실제 존 간 연간 비용 (HAZL 적용)
stat - HAZL 연간 절감액 ($)
stat - HAZL 존 간 트래픽 감소율 (%)
stat - 연간화 비용: HAZL 대 HAZL 미적용 기준선
timeseries - 존별 파드 수 (선택된 네임스페이스)
barchart - 존 불균형 비율 (최대/최소 파드)
stat - 구조적 존 간 스필 (편향으로 인한)
stat
Integrationskubernetes
Revisions
- Revision 1Converted from grafana.com revision 2Download JSON
Rate this dashboard
Sign in to rate.0 comments
No comments yet.