Lightweight APM for OpenTelemetry
How to import
In Datadog: Dashboards → New Dashboard → ⚙ Configure → Import dashboard JSON → paste this JSON.
Reactions
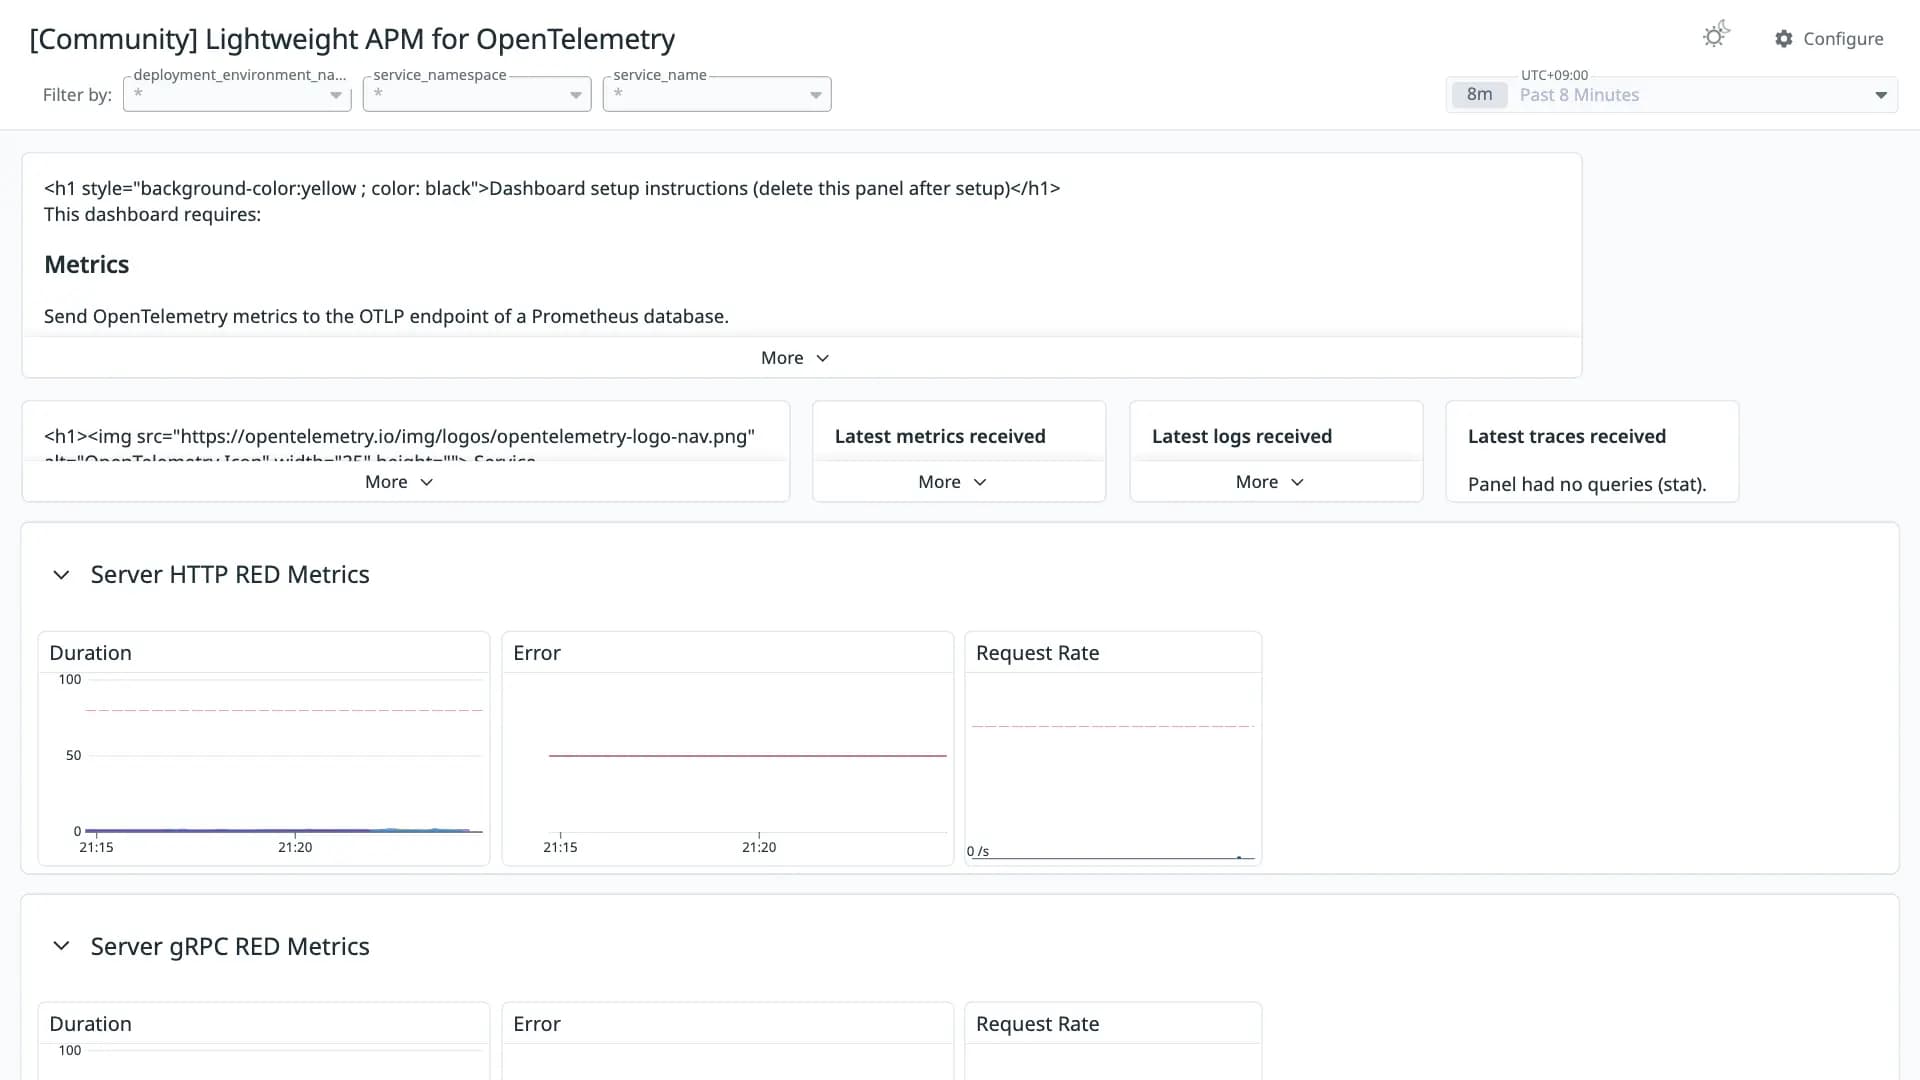
Lightweight APM dashboard for monitoring OpenTelemetry-based services. Instrument your applications using OpenTelemetry SDKs and send traces, metrics, and logs to Tempo for traces, a Prometheus-compatible database like Mimir for metrics, and Loki for logs. This dashboard provides a centralized view of your application's health and performance. For a fully managed observability stack, consider using Grafana Cloud. Learn more about this dashboard on https://github.com/cyrille-lecler
Conversion quality
Fair 61Share of panels whose queries were translated without loss. Partial and unsupported panels keep the original PromQL in a note widget.
- Native2
- OpenMetrics4
- Partial11
- Unsupported2
Metrics without a native Datadog mapping
These metric names were kept in OpenMetrics naming. Adjust them if you collect with a native Datadog integration.
http_server_request_duration_seconds_count ×5rpc_server_duration_milliseconds_count ×5http_server_request_duration_seconds_bucket ×3rpc_server_duration_milliseconds_bucket ×3http_client_request_duration_seconds_count ×2db_client_operation_duration_seconds_count ×2rpc_client_duration_milliseconds_count ×2http_server_request_duration_seconds_sumrpc_server_duration_milliseconds_sumhttp_client_request_duration_seconds_bucketdb_client_operation_duration_seconds_bucketrpc_client_duration_milliseconds_bucketjvm_cpu_recent_utilization_ratiojvm_gc_duration_seconds_sumUnsupported panels
- Latest metrics received
stat - Latest logs received
stat
Revisions
- Revision 1Converted from grafana.com revision 1Download JSON
Rate this dashboard
Sign in to rate.0 comments
No comments yet.