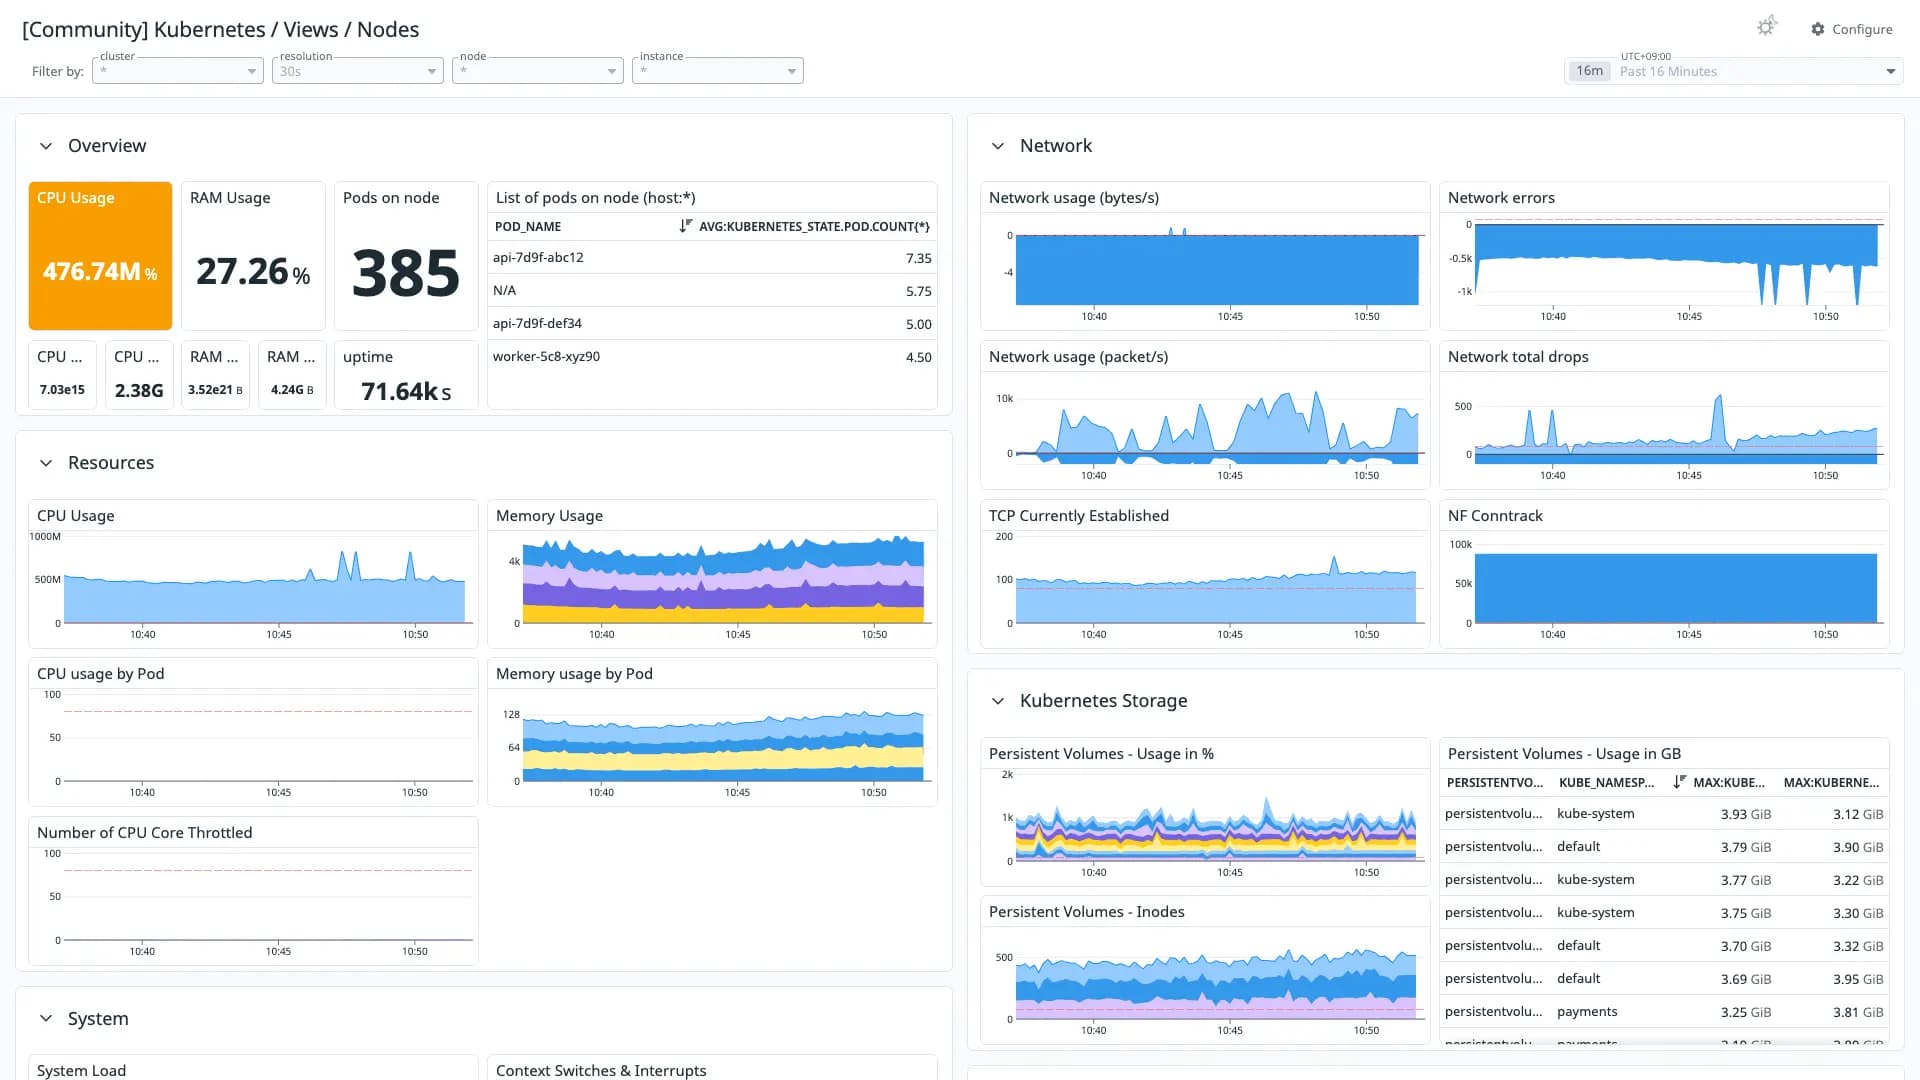
Kubernetes / Views / Nodes
Good 903 downloads0 views0 commentsRevision 1Created Converted from Grafana dashboard #15759 by dotdc
How to import
In Datadog: Dashboards → New Dashboard → ⚙ Configure → Import dashboard JSON → paste this JSON.
Reactions
This is a modern 'Nodes View' dashboard for your Kubernetes cluster(s). Made for kube-prometheus-stack and take advantage of the latest Grafana features. GitHub repository: https://github.com/dotdc/grafana-dashboards-kubernetes
Conversion quality
Good 90Share of panels whose queries were translated without loss. Partial and unsupported panels keep the original PromQL in a note widget.
- Native24
- OpenMetrics4
- Partial7
- Unsupported0
Metrics without a native Datadog mapping
These metric names were kept in OpenMetrics naming. Adjust them if you collect with a native Datadog integration.
node_cpu_core_throttles_totalnode_intr_totalnode_timex_estimated_error_secondsnode_timex_maxerror_secondsnode_disk_io_nownode_filesystem_device_errorRevisions
- Revision 1Converted from grafana.com revision 40Download JSON
Rate this dashboard
Sign in to rate.0 comments
No comments yet.