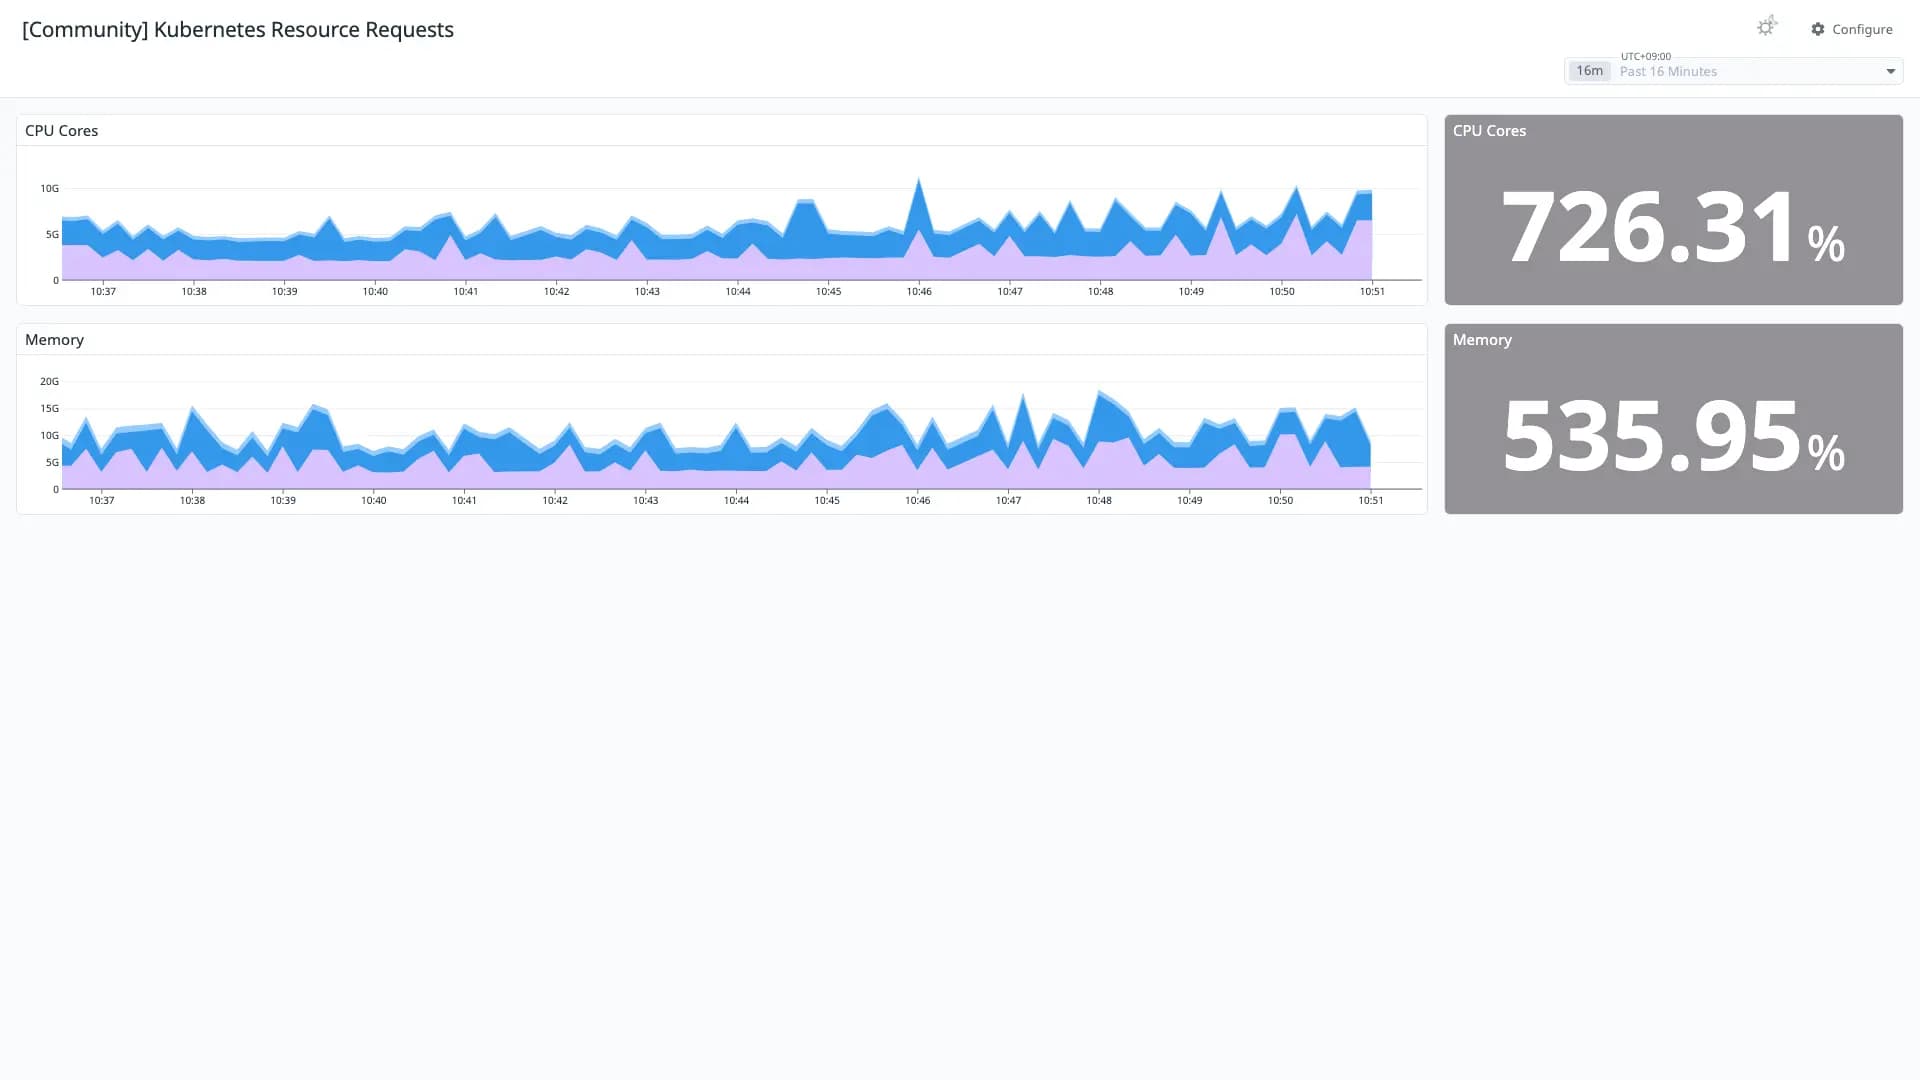
Kubernetes Resource Requests
Fair 503 downloads0 views0 commentsRevision 1Created Converted from Grafana dashboard #7187 by sekka1
How to import
In Datadog: Dashboards → New Dashboard → ⚙ Configure → Import dashboard JSON → paste this JSON.
Reactions
Dashboard to show the resource requests vs allocatable in the cluster
Conversion quality
Fair 50Share of panels whose queries were translated without loss. Partial and unsupported panels keep the original PromQL in a note widget.
- Native0
- OpenMetrics0
- Partial4
- Unsupported0
Tagskubernetes
Integrationskubernetes_state
Revisions
- Revision 1Converted from grafana.com revision 1Download JSON
Rate this dashboard
Sign in to rate.0 comments
No comments yet.