kubernetes-persistent-volumes
Fair 503 downloads0 views0 commentsRevision 1Created Converted from Grafana dashboard #13646 by Navodit
How to import
In Datadog: Dashboards → New Dashboard → ⚙ Configure → Import dashboard JSON → paste this JSON.
Reactions
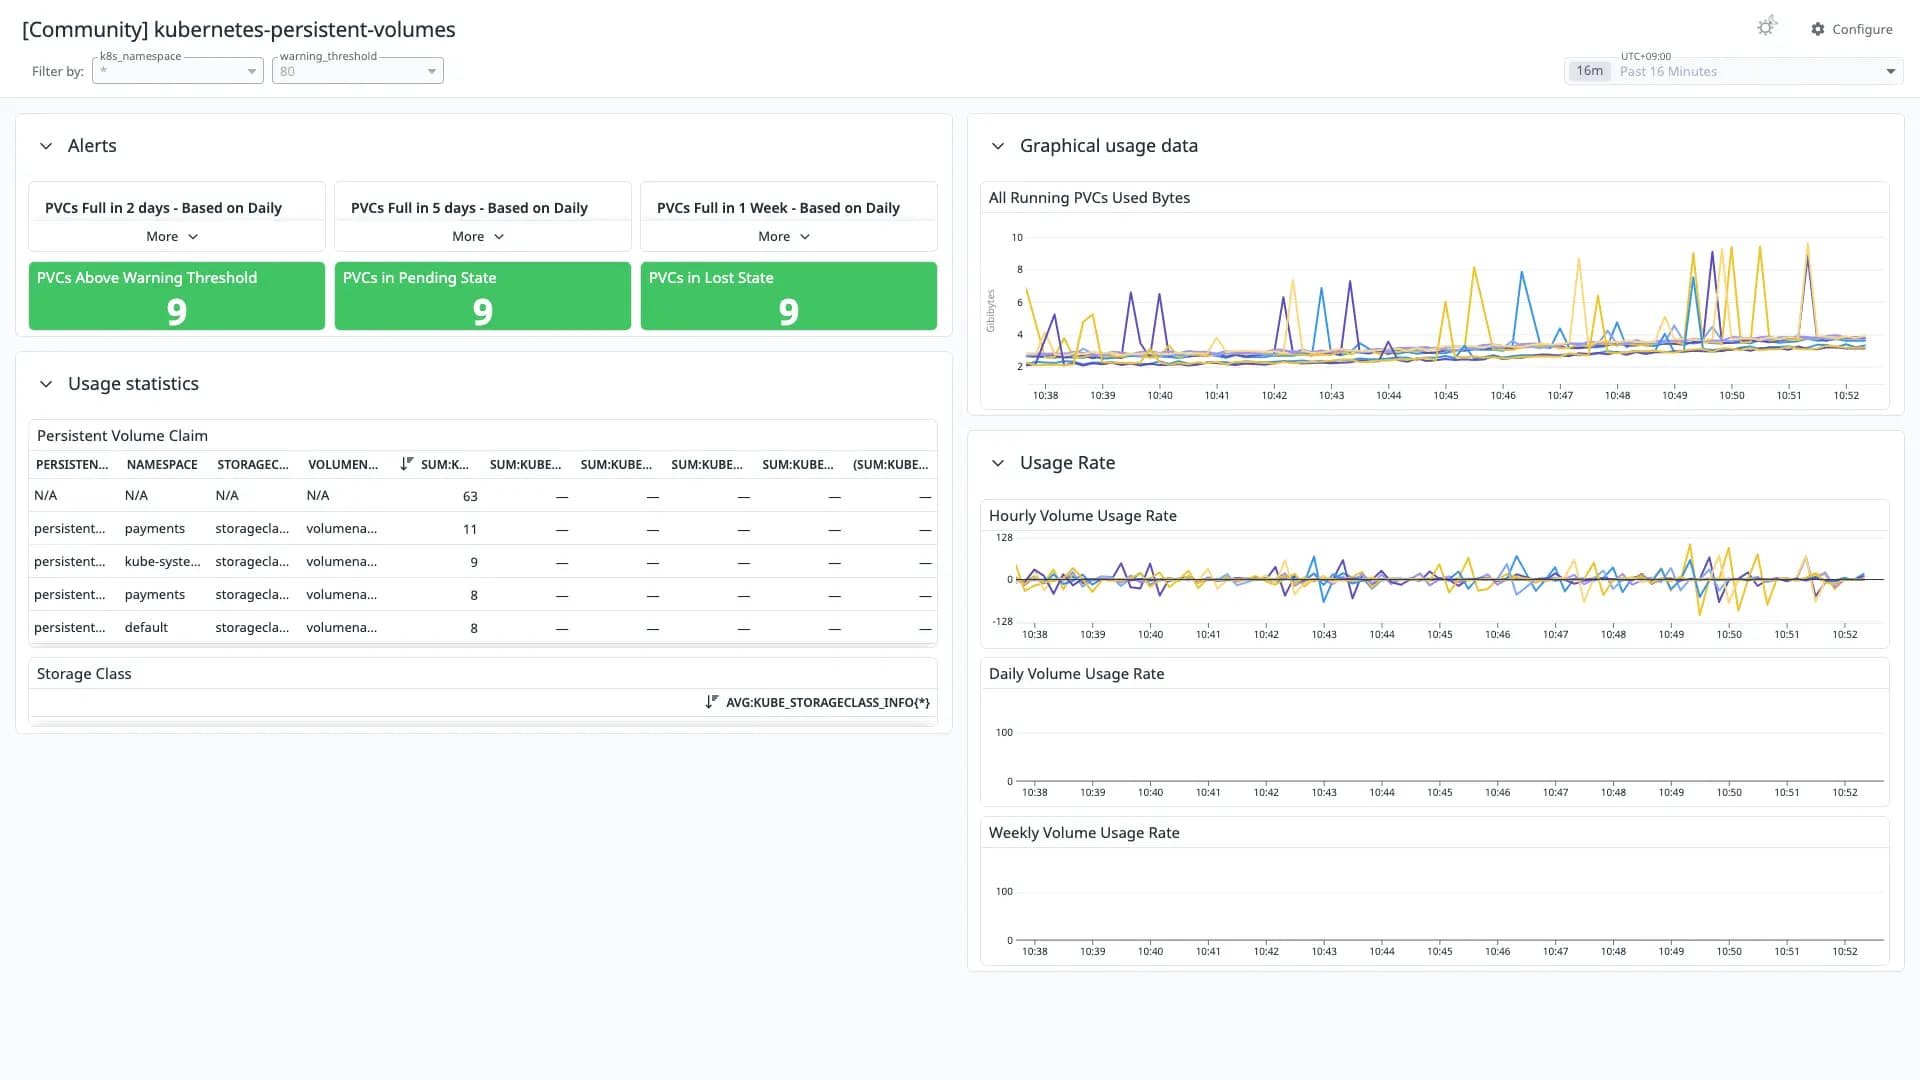
Monitors all persistent volumes that exists within a Kubernetes cluster. Prometheus is used as datasource.
Conversion quality
Fair 50Share of panels whose queries were translated without loss. Partial and unsupported panels keep the original PromQL in a note widget.
- Native1
- OpenMetrics2
- Partial6
- Unsupported3
Metrics without a native Datadog mapping
These metric names were kept in OpenMetrics naming. Adjust them if you collect with a native Datadog integration.
kube_persistentvolumeclaim_infokube_storageclass_infoUnsupported panels
- PVCs Full in 2 days - Based on Daily Usage
stat - PVCs Full in 5 days - Based on Daily Usage
stat - PVCs Full in 1 Week - Based on Daily Usage
stat
Tagsdocker
Revisions
- Revision 1Converted from grafana.com revision 2Download JSON
Rate this dashboard
Sign in to rate.0 comments
No comments yet.