Kubernetes pod and cluster monitoring (via Prometheus)
Fair 670 downloads0 views0 commentsRevision 1Created Converted from Grafana dashboard #6663 by rchakra3
How to import
In Datadog: Dashboards → New Dashboard → ⚙ Configure → Import dashboard JSON → paste this JSON.
Reactions
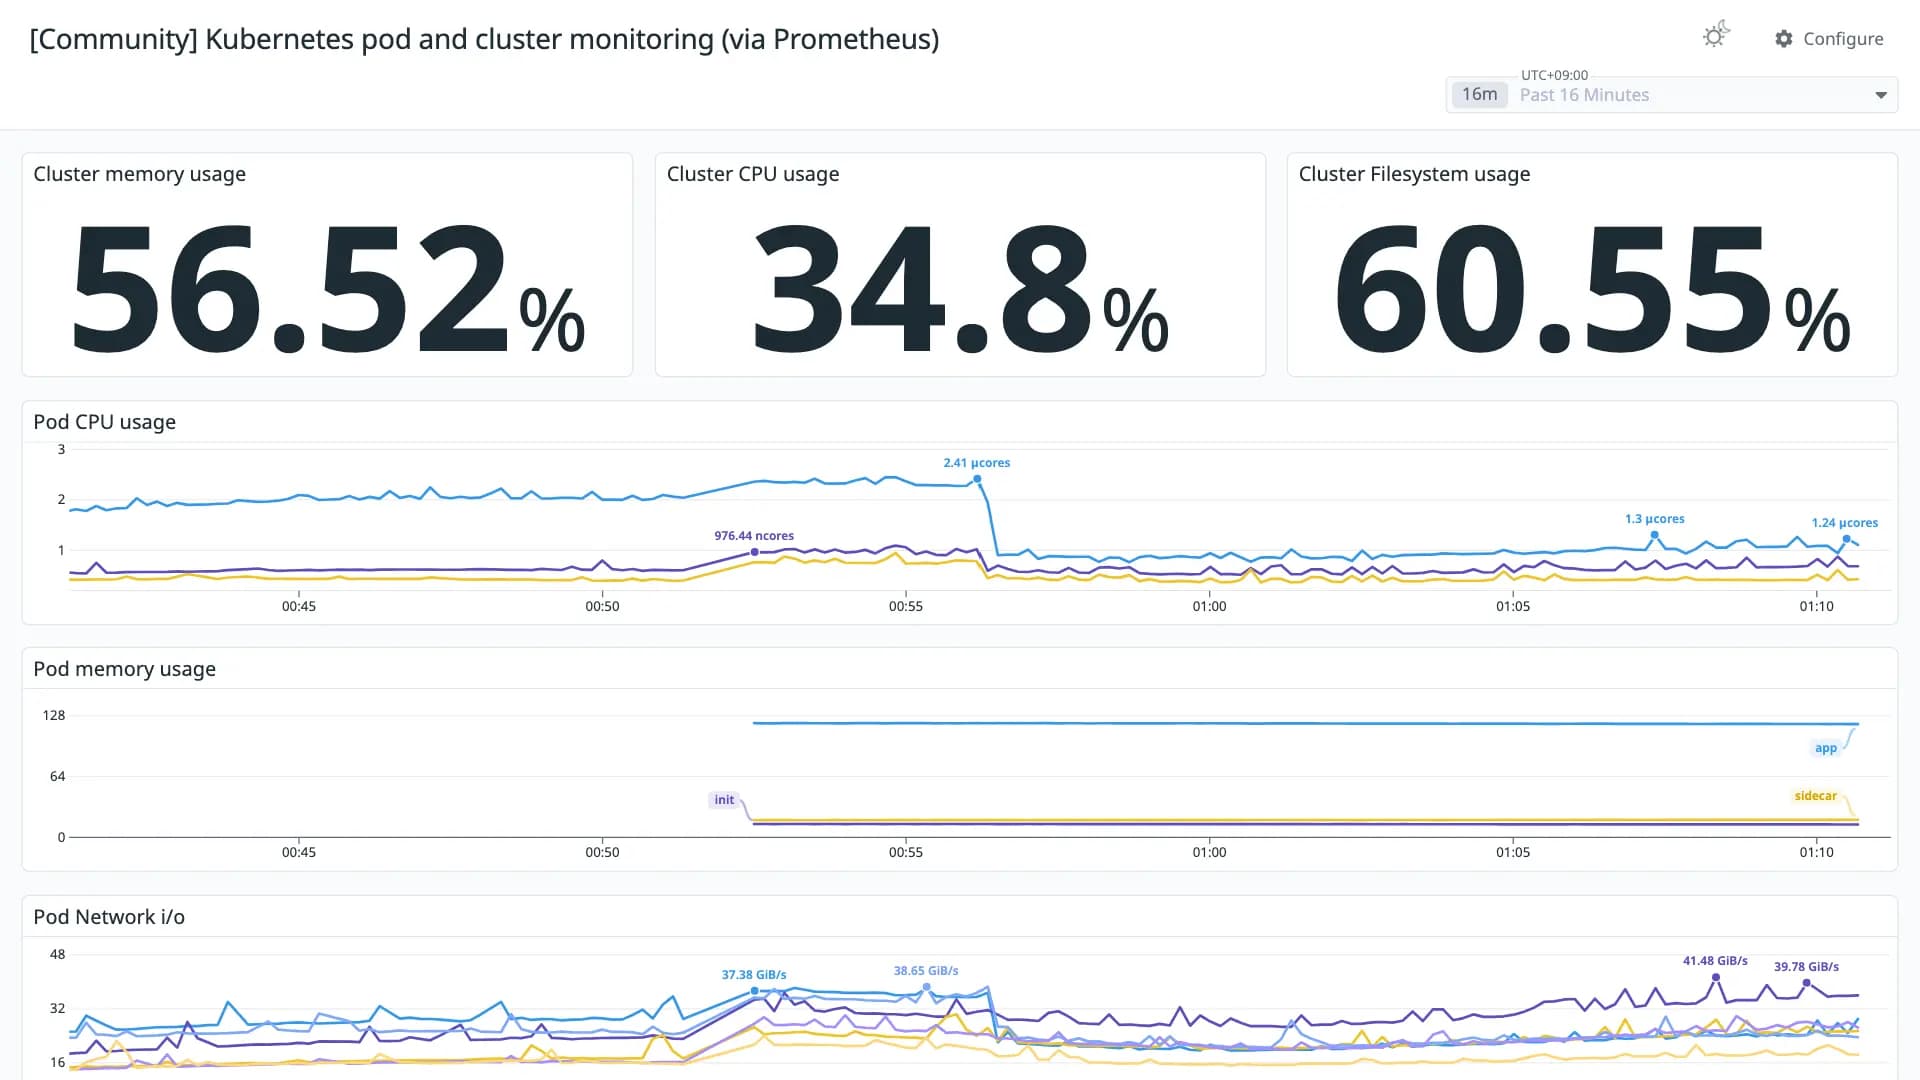
Monitor a Kubernetes cluster using Prometheus TSDB. Shows overall cluster CPU / Memory / Disk usage as well as individual pod statistics. Modified version of dashboard #162 to work with Prometheus 2.1+. Note - Managed Kubernetes instances (such as Azure AKS) might not give you access to FS stats, as you can see in the screenshot. You should be able to see those stats otherwise.
Conversion quality
Fair 67Share of panels whose queries were translated without loss. Partial and unsupported panels keep the original PromQL in a note widget.
- Native2
- OpenMetrics0
- Partial4
- Unsupported0
Tagskubernetes
Revisions
- Revision 1Converted from grafana.com revision 1Download JSON
Rate this dashboard
Sign in to rate.0 comments
No comments yet.