Kubernetes cluster monitoring (via Prometheus)
How to import
In Datadog: Dashboards → New Dashboard → ⚙ Configure → Import dashboard JSON → paste this JSON.
Reactions
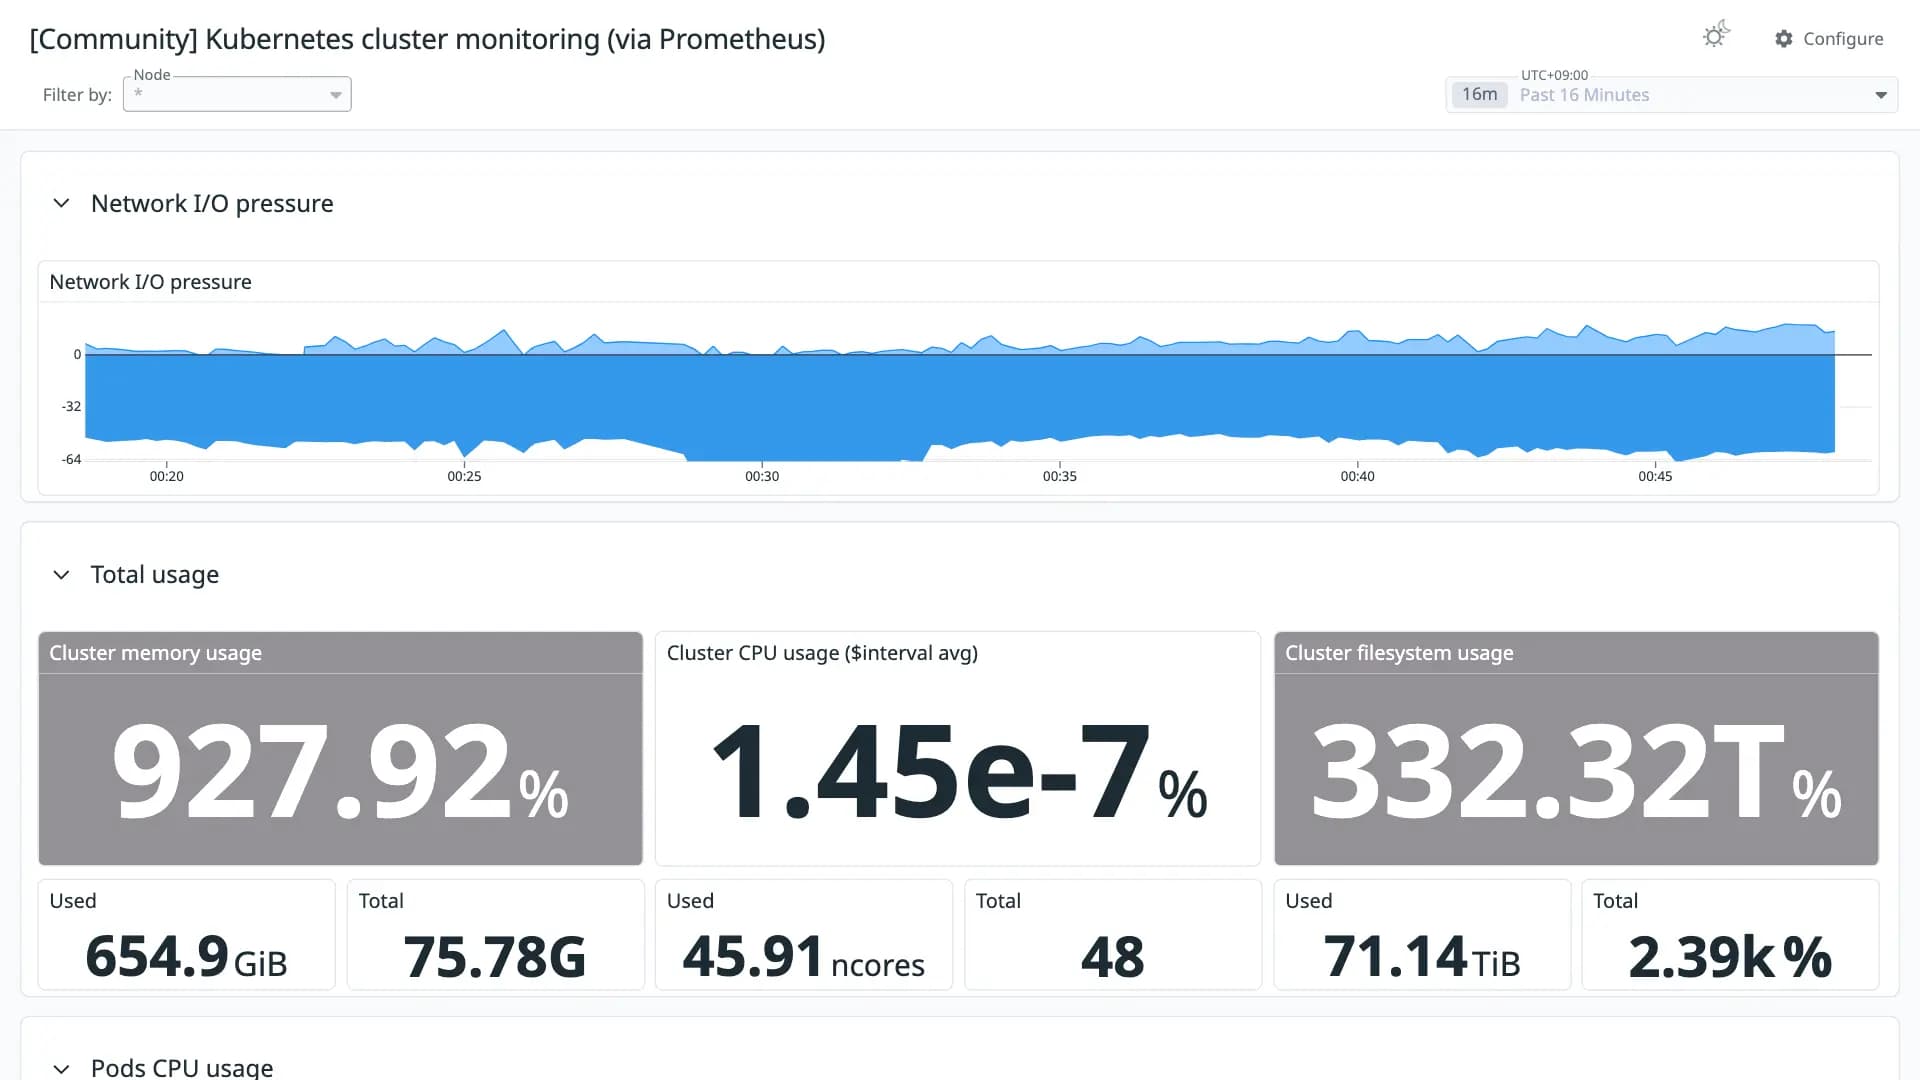
https://grafana.com/dashboards/3119 - Monitors Kubernetes cluster using Prometheus. Shows overall cluster CPU / Memory / Filesystem usage as well as individual pod, containers, control plane (as deployed by kops) statistics. Uses cAdvisor metrics only. Tweaked from original https://grafana.com/dashboards/315 to add templating for: - adaptable $interval (instead of hardcoded 1m) - selectable $datasource (very useful to have a single dashboard tackling several prometheis )
Conversion quality
Poor 45Share of panels whose queries were translated without loss. Partial and unsupported panels keep the original PromQL in a note widget.
- Native1
- OpenMetrics1
- Partial15
- Unsupported4
Metrics without a native Datadog mapping
These metric names were kept in OpenMetrics naming. Adjust them if you collect with a native Datadog integration.
container_memory_working_set_bytes ×3machine_cpu_coresUnsupported panels
- Containers CPU usage ($interval avg)
graph - All processes CPU usage ($interval avg)
graph - Containers network I/O ($interval avg)
graph - All processes network I/O ($interval avg)
graph
Revisions
- Revision 1Converted from grafana.com revision 2Download JSON
Rate this dashboard
Sign in to rate.0 comments
No comments yet.