K8s / Storage / Volumes / Cluster
Poor 250 downloads0 views0 commentsRevision 1Created Converted from Grafana dashboard #23207 by isisglima
How to import
In Datadog: Dashboards → New Dashboard → ⚙ Configure → Import dashboard JSON → paste this JSON.
Reactions
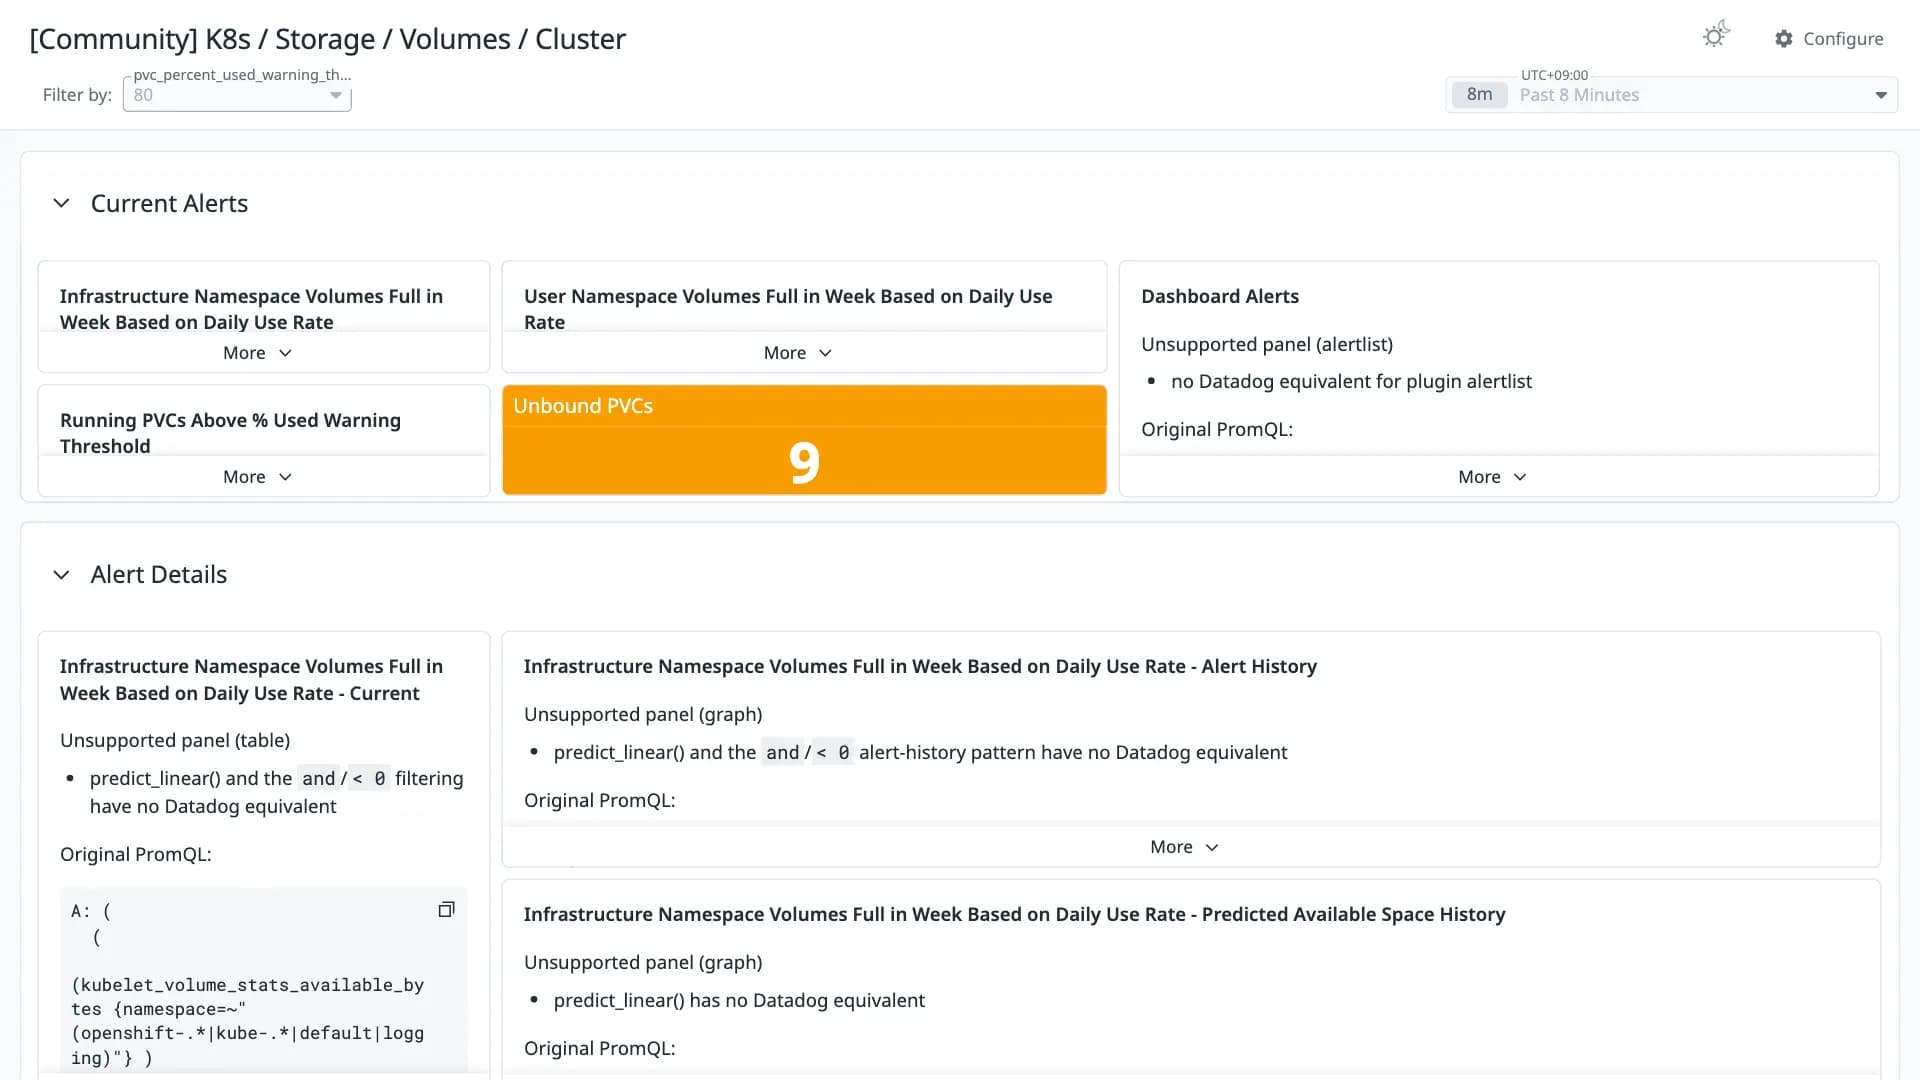
Dashboard of Kubernetes / OpenShift volume information at cluster level as exported by Prometheus connected to Kubernetes / OpenShift.
Conversion quality
Poor 25Share of panels whose queries were translated without loss. Partial and unsupported panels keep the original PromQL in a note widget.
- Native2
- OpenMetrics1
- Partial4
- Unsupported13
Metrics without a native Datadog mapping
These metric names were kept in OpenMetrics naming. Adjust them if you collect with a native Datadog integration.
pv_collector_unbound_pvc_countpv_collector_bound_pvc_countkube_persistentvolumeclaim_infoUnsupported panels
- Infrastructure Namespace Volumes Full in Week Based on Daily Use Rate
singlestat - User Namespace Volumes Full in Week Based on Daily Use Rate
singlestat - Dashboard Alerts
alertlist - Running PVCs Above % Used Warning Threshold
singlestat - Infrastructure Namespace Volumes Full in Week Based on Daily Use Rate - Current
table - Infrastructure Namespace Volumes Full in Week Based on Daily Use Rate - Alert History
graph - Infrastructure Namespace Volumes Full in Week Based on Daily Use Rate - Predicted Available Space History
graph - User Namespace Volumes Full in Week Based on Daily Use Rate - Current
table - User Namespace Volumes Full in Week Based on Daily Use Rate - Alert History
graph - User Namespace Volumes Full in Week Based on Daily Use Rate - Predicted Available Space History
graph - Running PVCs Above % Used Warning Threshold Stats - Current
table - Running PVCs Above % Used Warning Threshold - History
graph - PVC Stats
table
Integrationskubernetes
Revisions
- Revision 1Converted from grafana.com revision 1Download JSON
Rate this dashboard
Sign in to rate.0 comments
No comments yet.