k6 Prometheus
가져오는 방법
Datadog에서 Dashboards → New Dashboard → ⚙ Configure → Import dashboard JSON 순으로 이동한 뒤 이 JSON을 붙여넣으세요.
반응
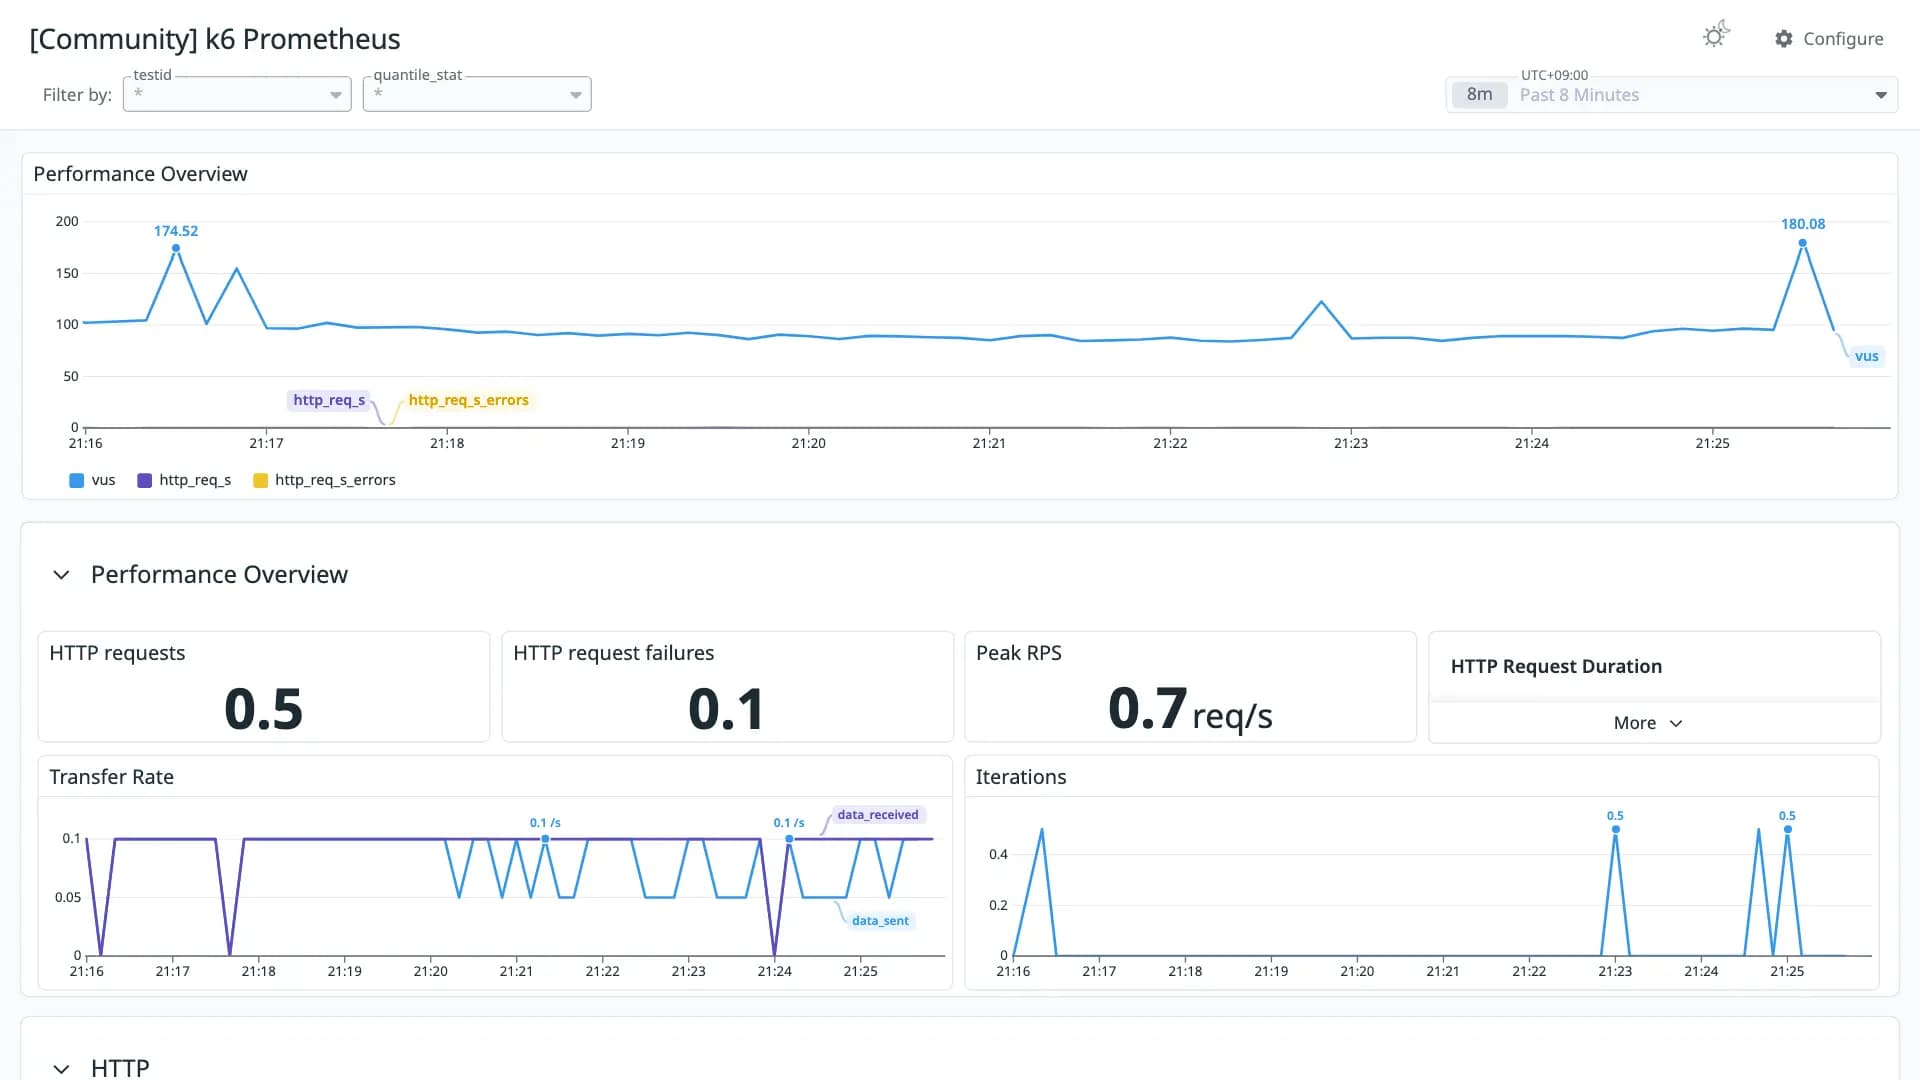
Visualize k6 OSS results stored in Prometheus
변환 품질
보통 64쿼리가 손실 없이 변환된 패널의 비율입니다. 일부만 변환됐거나 지원되지 않는 패널은 원본 PromQL을 노트 위젯에 그대로 남겨 둡니다.
- 기본 통합1
- OpenMetrics8
- 일부 변환0
- 미지원5
Datadog 기본 통합 메트릭으로 매핑되지 않은 항목
OpenMetrics 이름을 그대로 사용한 메트릭입니다. Datadog 기본 통합으로 수집 중이라면 메트릭 이름을 맞춰 주세요.
k6_http_reqs_total ×8k6_checks_rate ×2k6_vusk6_data_sent_totalk6_data_received_totalk6_dropped_iterations_totalk6_http_req_duration_mink6_http_req_duration_maxk6_http_req_duration_p95k6_http_req_duration_p99지원되지 않는 패널
- Performance Overview
timeseries - HTTP Request Duration
stat - Iterations
timeseries - HTTP Latency Timings
timeseries - HTTP Latency Stats
timeseries
리비전 이력
- 리비전 1Converted from grafana.com revision 1JSON 다운로드
이 대시보드 평가하기
평가하려면 로그인이 필요합니다.댓글 0개
아직 댓글이 없습니다.