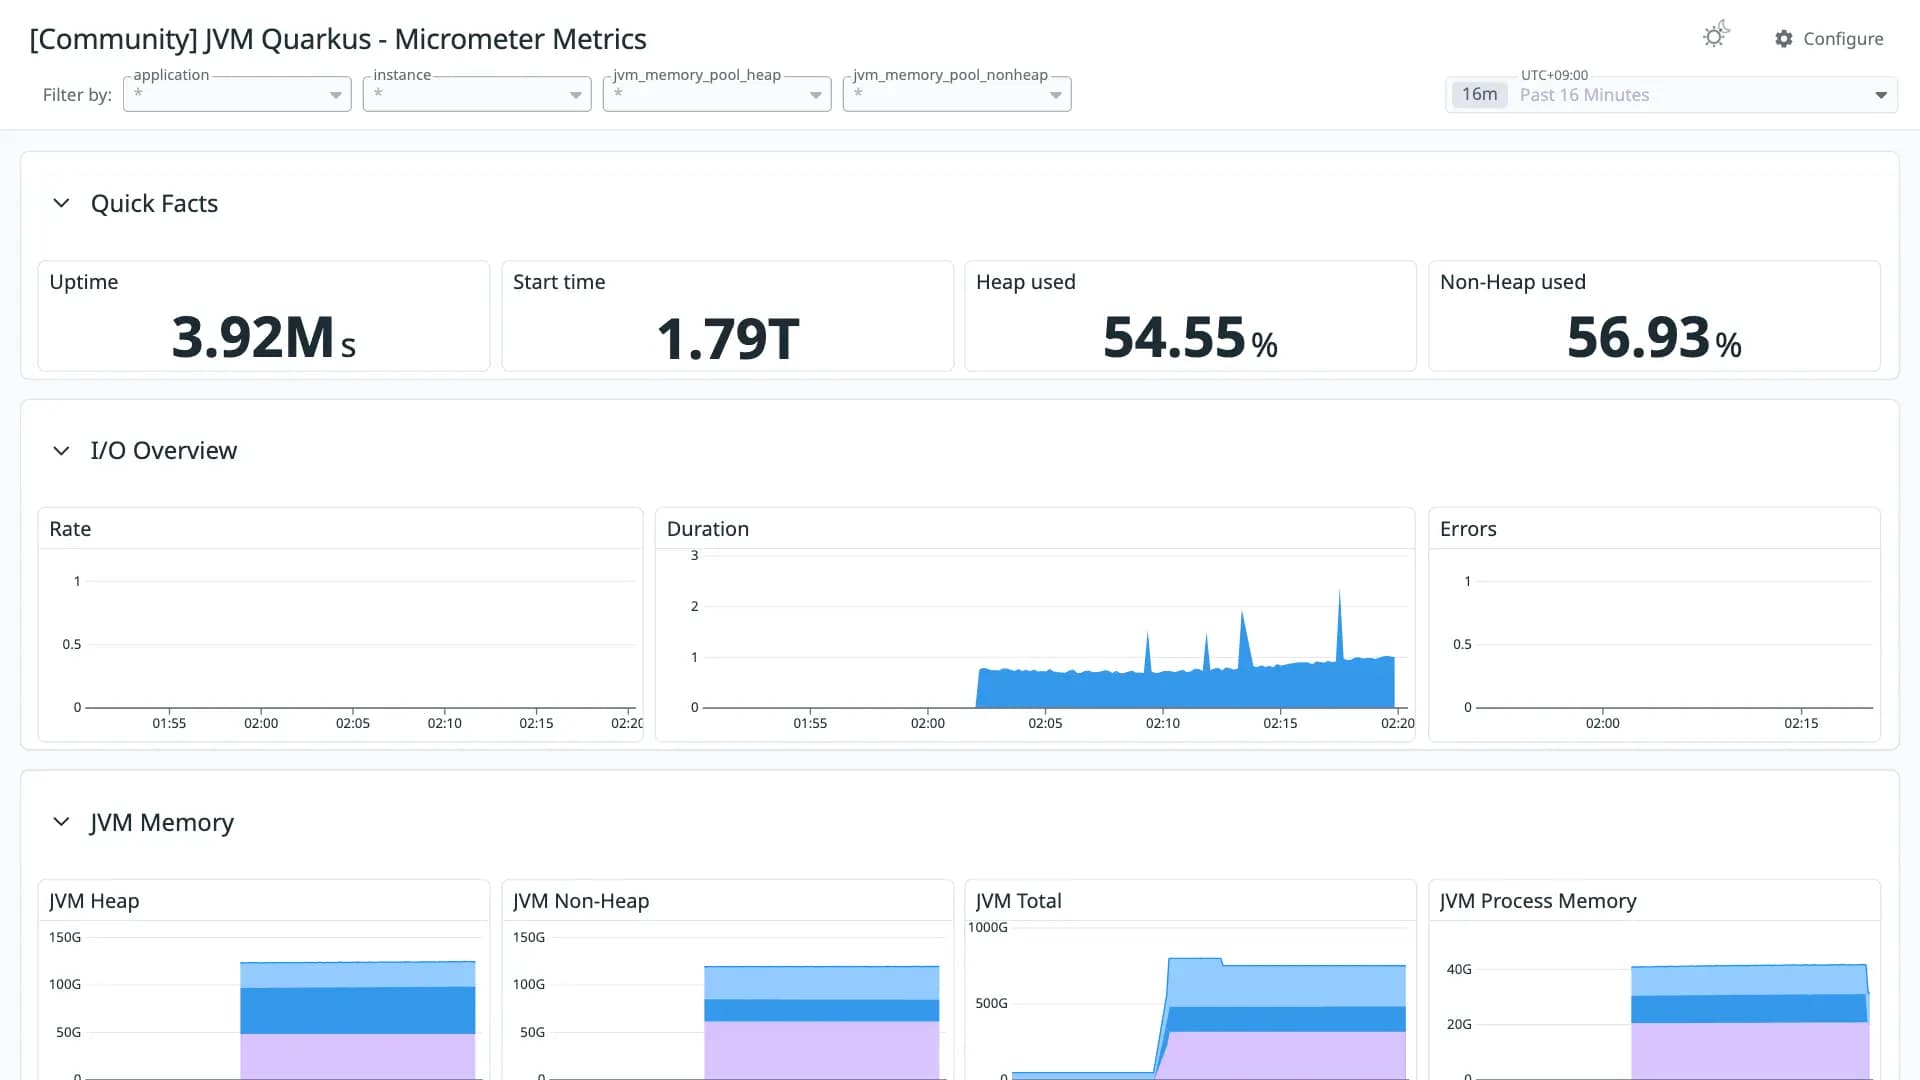
JVM Quarkus - Micrometer Metrics
Good 990 downloads0 views0 commentsRevision 1Created Converted from Grafana dashboard #14370 by aoot
How to import
In Datadog: Dashboards → New Dashboard → ⚙ Configure → Import dashboard JSON → paste this JSON.
Reactions
Dashboard for Micrometer instrumented applications (Java, Spring Boot, Micronaut)
Conversion quality
Good 99Share of panels whose queries were translated without loss. Partial and unsupported panels keep the original PromQL in a note widget.
- Native4
- OpenMetrics30
- Partial1
- Unsupported0
Metrics without a native Datadog mapping
These metric names were kept in OpenMetrics naming. Adjust them if you collect with a native Datadog integration.
jvm_memory_used_bytes ×7jvm_memory_max_bytes ×7http_server_requests_seconds_count ×5jvm_memory_committed_bytes ×5http_server_requests_seconds_sum ×3http_server_requests_seconds_max ×2process_memory_rss_bytes ×2process_memory_swap_bytes ×2jvm_gc_pause_seconds_count ×2mp_graphql_seconds_count ×2mp_graphql_seconds_sum ×2process_uptime_secondsprocess_start_time_secondssystem_cpu_usageprocess_cpu_usagesystem_load_average_1msystem_cpu_countjvm_threads_states_threadsjvm_threads_live_threadsjvm_threads_daemon_threadsjvm_threads_peak_threadsprocess_threadsprocess_files_open_filesprocess_files_max_filesjvm_gc_pause_seconds_sumjvm_gc_pause_seconds_maxjvm_gc_memory_allocated_bytes_totaljvm_gc_memory_promoted_bytes_totaljvm_classes_loaded_classesmp_graphql_seconds_maxRevisions
- Revision 1Converted from grafana.com revision 6Download JSON
Rate this dashboard
Sign in to rate.0 comments
No comments yet.