Spring Boot 2.1 System Monitor
Good 1002 downloads0 views0 commentsRevision 1Created Converted from Grafana dashboard #11378 by malltshik
How to import
In Datadog: Dashboards → New Dashboard → ⚙ Configure → Import dashboard JSON → paste this JSON.
Reactions
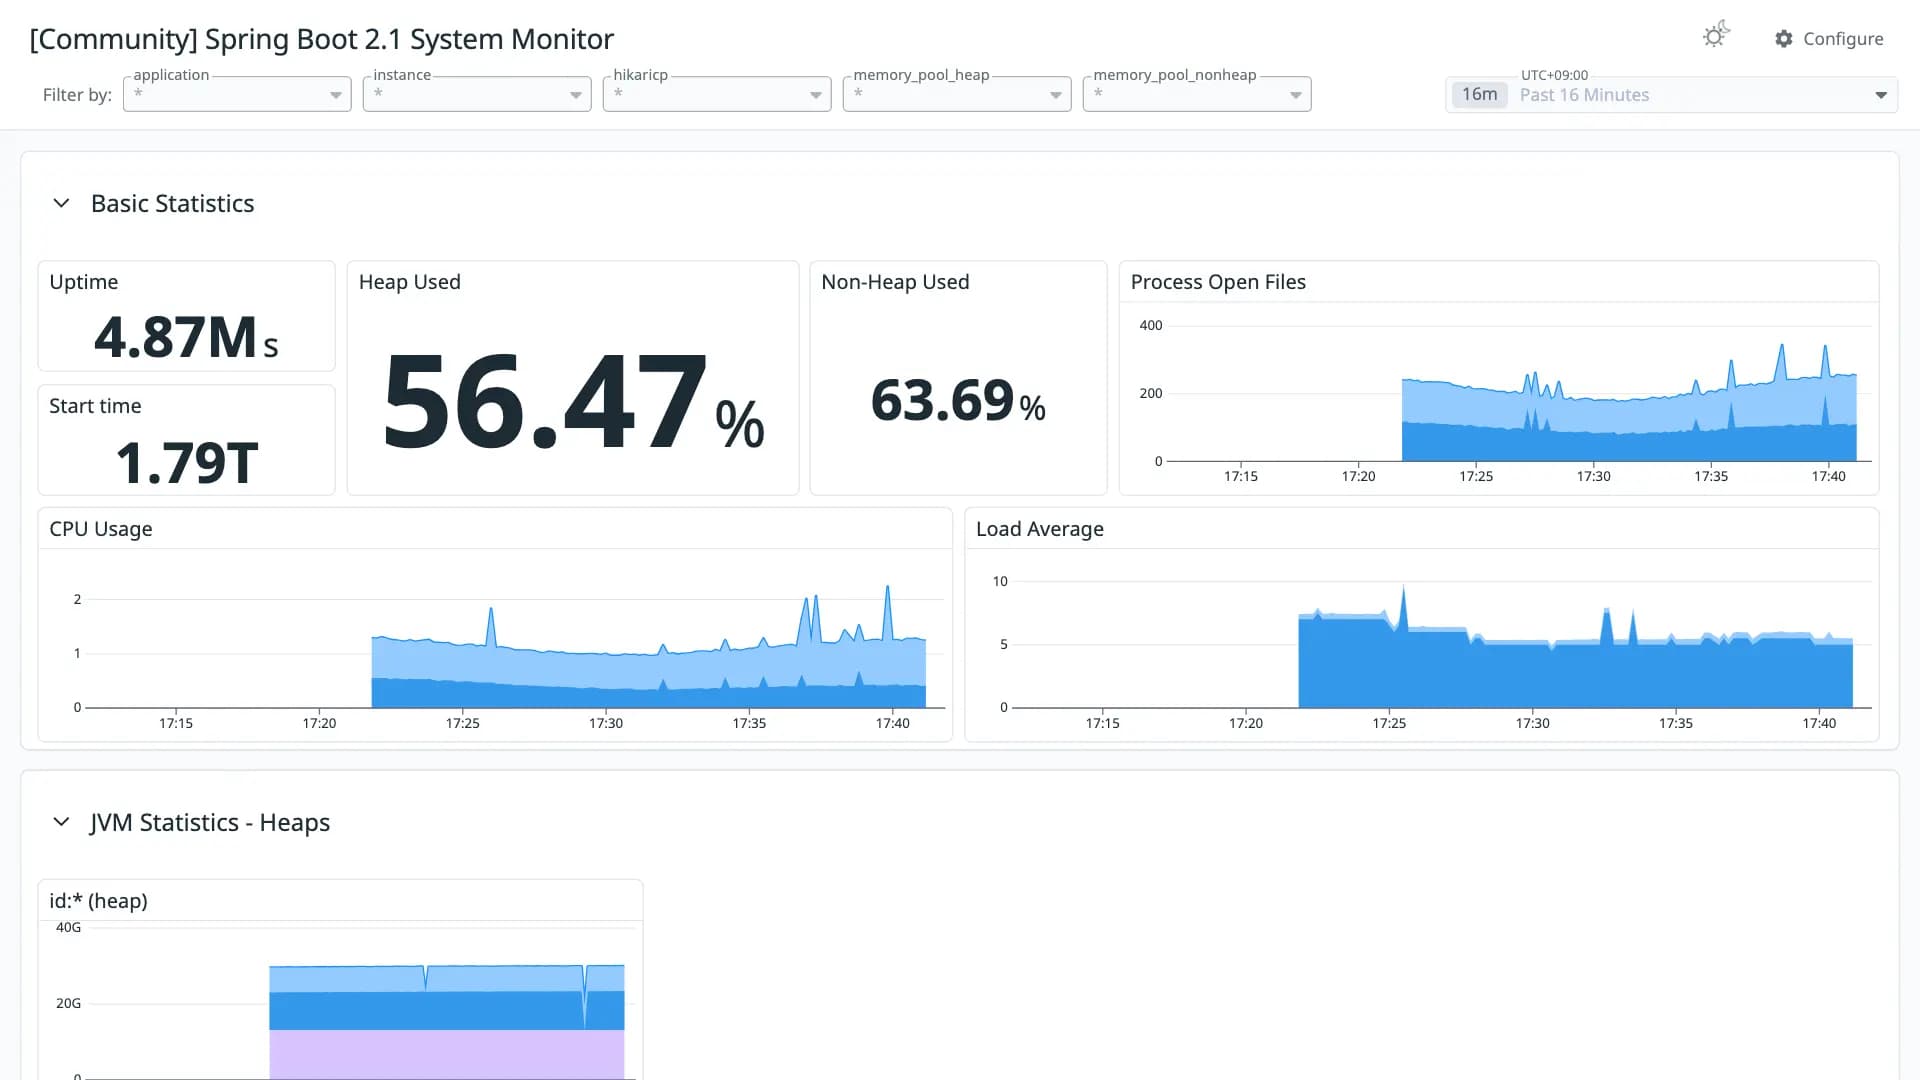
Dashboard for Spring Boot2.1 Statistics(based on Spring Boot2 Statistic by micrometer-prometheus).
Conversion quality
Good 100Share of panels whose queries were translated without loss. Partial and unsupported panels keep the original PromQL in a note widget.
- Native0
- OpenMetrics35
- Partial0
- Unsupported0
Metrics without a native Datadog mapping
These metric names were kept in OpenMetrics naming. Adjust them if you collect with a native Datadog integration.
http_server_requests_seconds_count ×7logback_events_total ×5jvm_memory_used_bytes ×4jvm_memory_max_bytes ×4jvm_memory_committed_bytes ×2jvm_buffer_memory_used_bytes ×2jvm_buffer_total_capacity_bytes ×2process_uptime_secondsprocess_files_open_filesprocess_files_max_filesprocess_start_time_secondssystem_cpu_usageprocess_cpu_usagesystem_load_average_1msystem_cpu_countjvm_threads_daemon_threadsjvm_threads_live_threadsjvm_threads_peak_threadsjvm_gc_memory_allocated_bytes_totaljvm_gc_memory_promoted_bytes_totaljvm_classes_loaded_classesjvm_classes_unloaded_classes_totaljvm_gc_pause_seconds_countjvm_gc_pause_seconds_sumhikaricp_connectionshikaricp_connections_activehikaricp_connections_idlehikaricp_connections_pendinghikaricp_connections_timeout_totalhikaricp_connections_creation_seconds_sumhikaricp_connections_creation_seconds_counthikaricp_connections_usage_seconds_sumhikaricp_connections_usage_seconds_counthikaricp_connections_acquire_seconds_sumhikaricp_connections_acquire_seconds_countjetty_threads_config_minjetty_threads_config_maxhttp_server_requests_seconds_sumhttp_server_requests_seconds_maxjetty_threads_currentjetty_threads_busyjetty_threads_idlejetty_threads_jobsTagsweb servers
Revisions
- Revision 1Converted from grafana.com revision 2Download JSON
Rate this dashboard
Sign in to rate.0 comments
No comments yet.