Hedgehog Agent Stats
Fair 500 downloads0 views0 commentsRevision 1Created Converted from Grafana dashboard #24389 by githedgehog
How to import
In Datadog: Dashboards → New Dashboard → ⚙ Configure → Import dashboard JSON → paste this JSON.
Reactions
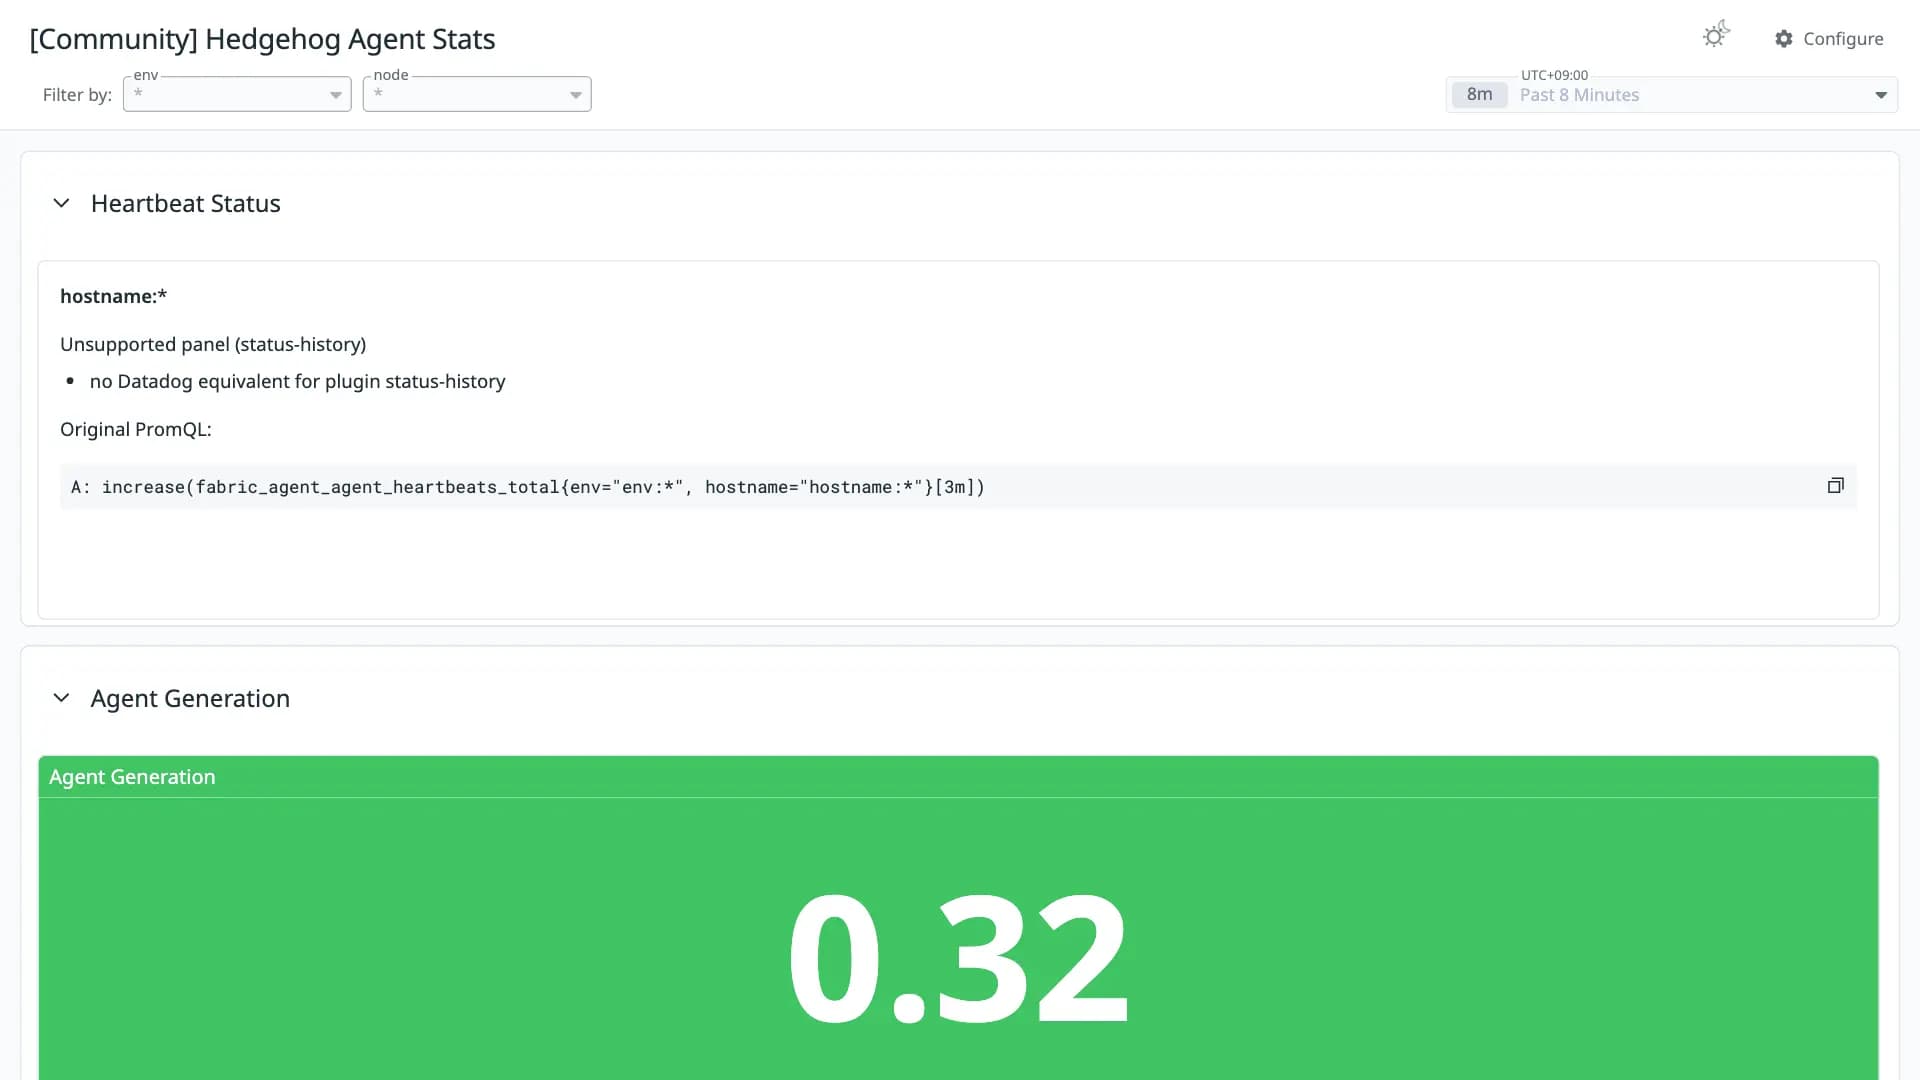
This dashboard shows the status of the Agent on the switches, hearbeats, version, and configuration. The Hedgehog fabric runs on SONiC switches providing virtual private clouds (VPCs) managed by k8s APIs. Great for multi-tenancy and AI Networking
Conversion quality
Fair 50Share of panels whose queries were translated without loss. Partial and unsupported panels keep the original PromQL in a note widget.
- Native0
- OpenMetrics1
- Partial0
- Unsupported1
Metrics without a native Datadog mapping
These metric names were kept in OpenMetrics naming. Adjust them if you collect with a native Datadog integration.
fabric_agent_agent_generationUnsupported panels
- $node
status-history
Revisions
- Revision 1Converted from grafana.com revision 1Download JSON
Rate this dashboard
Sign in to rate.0 comments
No comments yet.