ElasticSearch
Fair 770 downloads0 views0 commentsRevision 1Created Converted from Grafana dashboard #24111 by arnaudlemaignen
How to import
In Datadog: Dashboards → New Dashboard → ⚙ Configure → Import dashboard JSON → paste this JSON.
Reactions
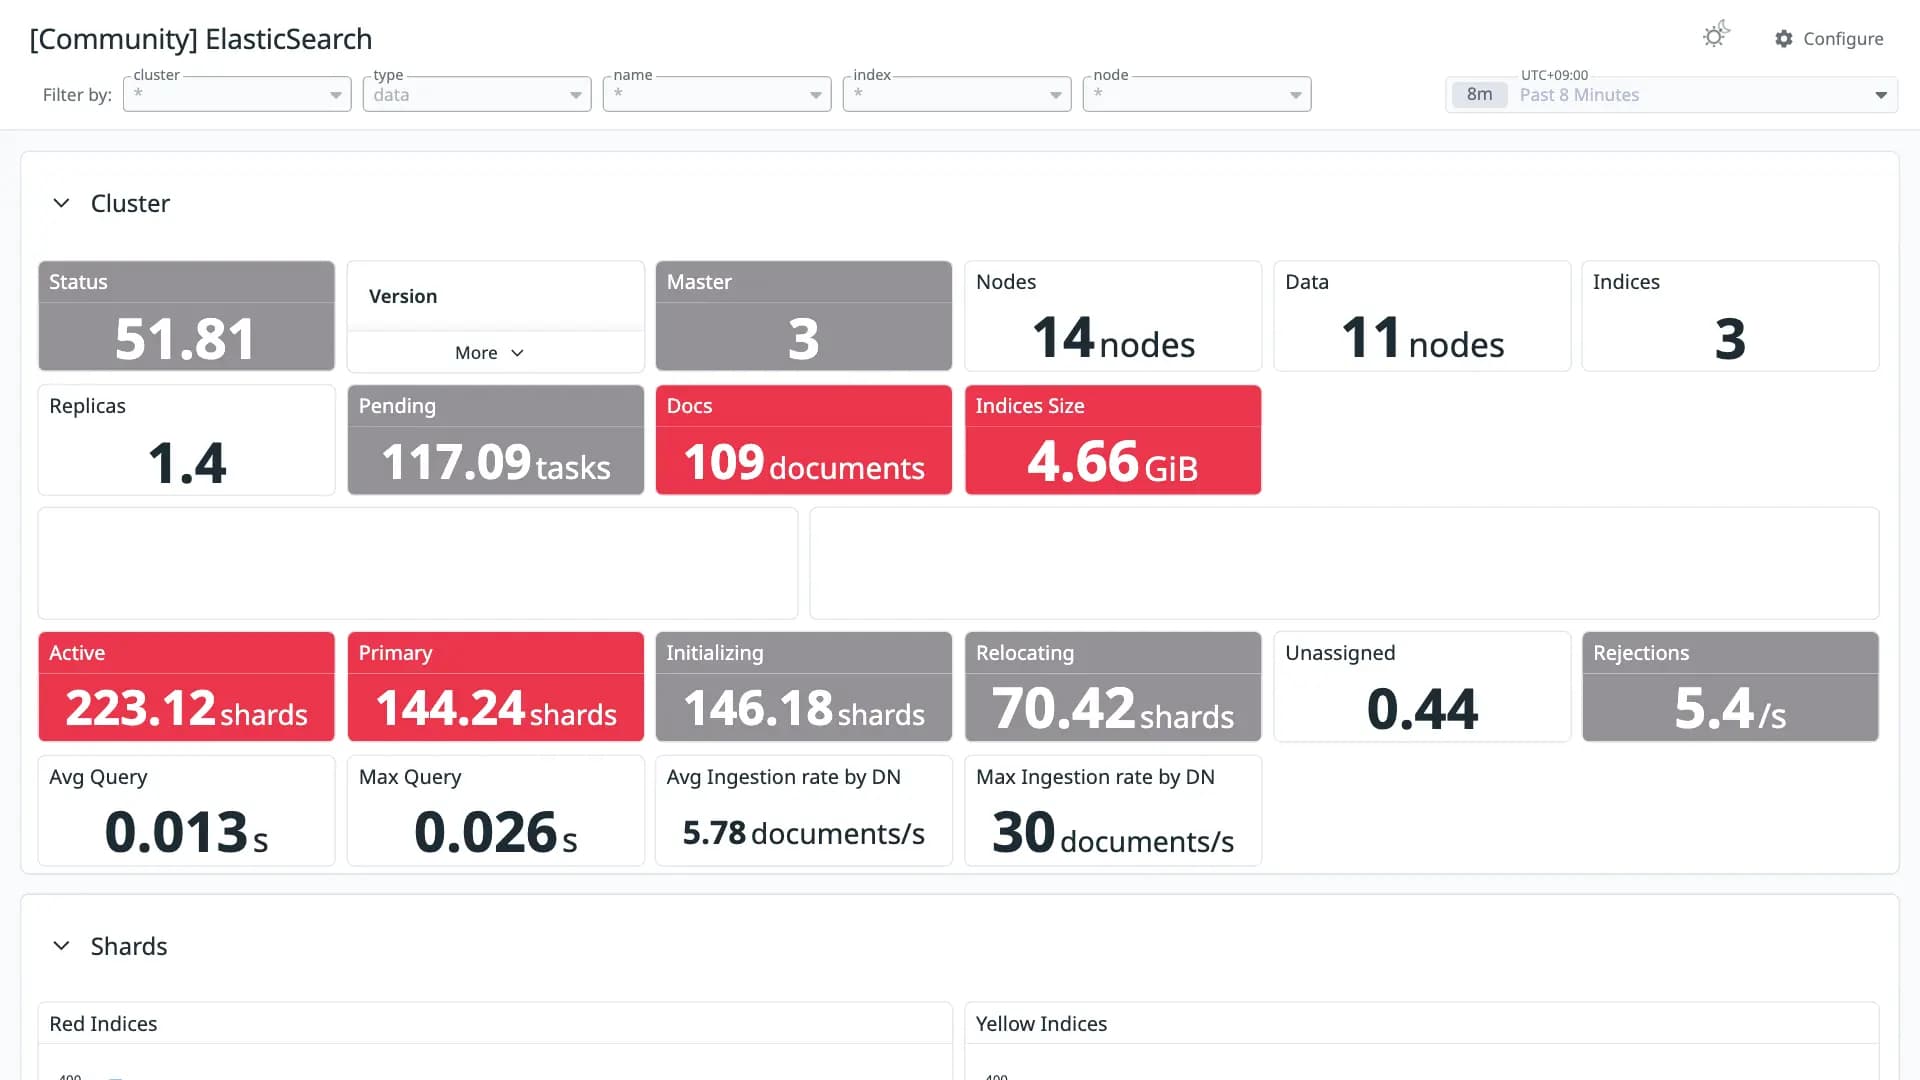
ElasticSearch Overview
Conversion quality
Fair 77Share of panels whose queries were translated without loss. Partial and unsupported panels keep the original PromQL in a note widget.
- Native16
- OpenMetrics25
- Partial26
- Unsupported3
Metrics without a native Datadog mapping
These metric names were kept in OpenMetrics naming. Adjust them if you collect with a native Datadog integration.
elasticsearch_indices_store_size_bytes_total ×2elasticsearch_indices_indexing_index_time_seconds_total ×2elasticsearch_indices_search_query_time_seconds ×2elasticsearch_indices_search_fetch_time_seconds ×2elasticsearch_indices_merges_total_time_seconds_total ×2elasticsearch_indices_refresh_time_seconds_total ×2elasticsearch_indices_flush_time_seconds ×2elasticsearch_indices_indexing_index_total ×2elasticsearch_indices_search_query_total ×2elasticsearch_indices_search_fetch_total ×2elasticsearch_indices_merges_total ×2elasticsearch_indices_refresh_total ×2elasticsearch_indices_flush_total ×2elasticsearch_process_cpu_percentelasticsearch_indices_segment_count_totalelasticsearch_cluster_health_delayed_unassigned_shardses_cluster_health_indices_status_redes_cluster_health_indices_status_yellowes_cluster_health_indices_unassigned_shardses_cluster_health_indices_relocating_shardses_cluster_health_indices_initializing_shardses_cluster_health_indices_active_shardses_cluster_health_indices_active_primary_shardses_cluster_health_indices_number_of_replicaselasticsearch_index_stats_get_totalelasticsearch_index_stats_search_fetch_totalelasticsearch_index_stats_flush_totalelasticsearch_index_stats_indexing_index_totalelasticsearch_index_stats_indexing_delete_totalelasticsearch_index_stats_merge_totalelasticsearch_index_stats_refresh_totalelasticsearch_index_stats_search_query_totalelasticsearch_index_stats_search_scroll_totalelasticsearch_index_stats_search_suggest_totalelasticsearch_index_stats_warmer_totalelasticsearch_thread_pool_active_countelasticsearch_thread_pool_queue_countelasticsearch_thread_pool_completed_countelasticsearch_thread_pool_rejected_countelasticsearch_process_cpu_seconds_totaljvm_memory_pool_max_bytesjvm_gc_collection_seconds_sumelasticsearch_indices_query_cache_memory_size_byteselasticsearch_index_stats_query_cache_hits_totalelasticsearch_index_stats_query_cache_misses_totalelasticsearch_indices_request_cache_memory_size_byteselasticsearch_index_stats_request_cache_hits_totalelasticsearch_index_stats_request_cache_misses_totalelasticsearch_indices_fielddata_memory_size_bytesUnsupported panels
- Version
stat - Node Usage %
timeseries - Time spent in GC
timeseries
Tagselasticsearch
Revisions
- Revision 1Converted from grafana.com revision 1Download JSON
Rate this dashboard
Sign in to rate.0 comments
No comments yet.