Consens Node
Good 870 downloads0 views0 commentsRevision 1Created Converted from Grafana dashboard #20395 by Redbelly Network
How to import
In Datadog: Dashboards → New Dashboard → ⚙ Configure → Import dashboard JSON → paste this JSON.
Reactions
Conversion quality
Good 87Share of panels whose queries were translated without loss. Partial and unsupported panels keep the original PromQL in a note widget.
- Native3
- OpenMetrics119
- Partial3
- Unsupported17
Metrics without a native Datadog mapping
These metric names were kept in OpenMetrics naming. Adjust them if you collect with a native Datadog integration.
rbn_consensus_proposal_batches_bucket ×6block_process_time_bucket ×6superblock_process_time_bucket ×6tx_batches_size_bucket ×5tx_batches_gas_cost_bucket ×5block_process_wait_time_bucket ×5rbn_consensus_pending_proposal_size_on_decide_bucket ×5rbn_consensus_consensus_wait_time_bucket ×5super_block_index ×4chain_head_header ×3executed_txs_successful ×3rbn_consensus_consensus_times_count ×3tx_route_time_bucket ×3block_process_time_count ×2is_governor ×2bootnodes_superblock ×2network_block ×2executed_txs_failure ×2txs_batches_proposed ×2txs_batches_committed ×2rbn_database_txs_size_total ×2txs_gas_total ×2permissioned_addresses_events ×2governor_count ×2downloader_ops ×2rbn_consensus_blocks_committed_by_id ×2txpool_pending ×2txpool_queued ×2block_indexcertificate_not_aftercertificate_not_beforepersisted_txs_totalrpc_duration_allrpc_duration_all_counttx_routed_activetx_routed_successtx_routed_failextenders_countbusiness_users_revokedpermission_cache_flushespermissions_allowedpermissions_rejectedpermission_tracker_cache_hitspermission_tracker_cache_missescandidate_changesupdated_network_eventsgovernor_upgradesreconfig_tx_sentreconfig_tx_failedrbn_consensus_consensus_round_startUnsupported panels
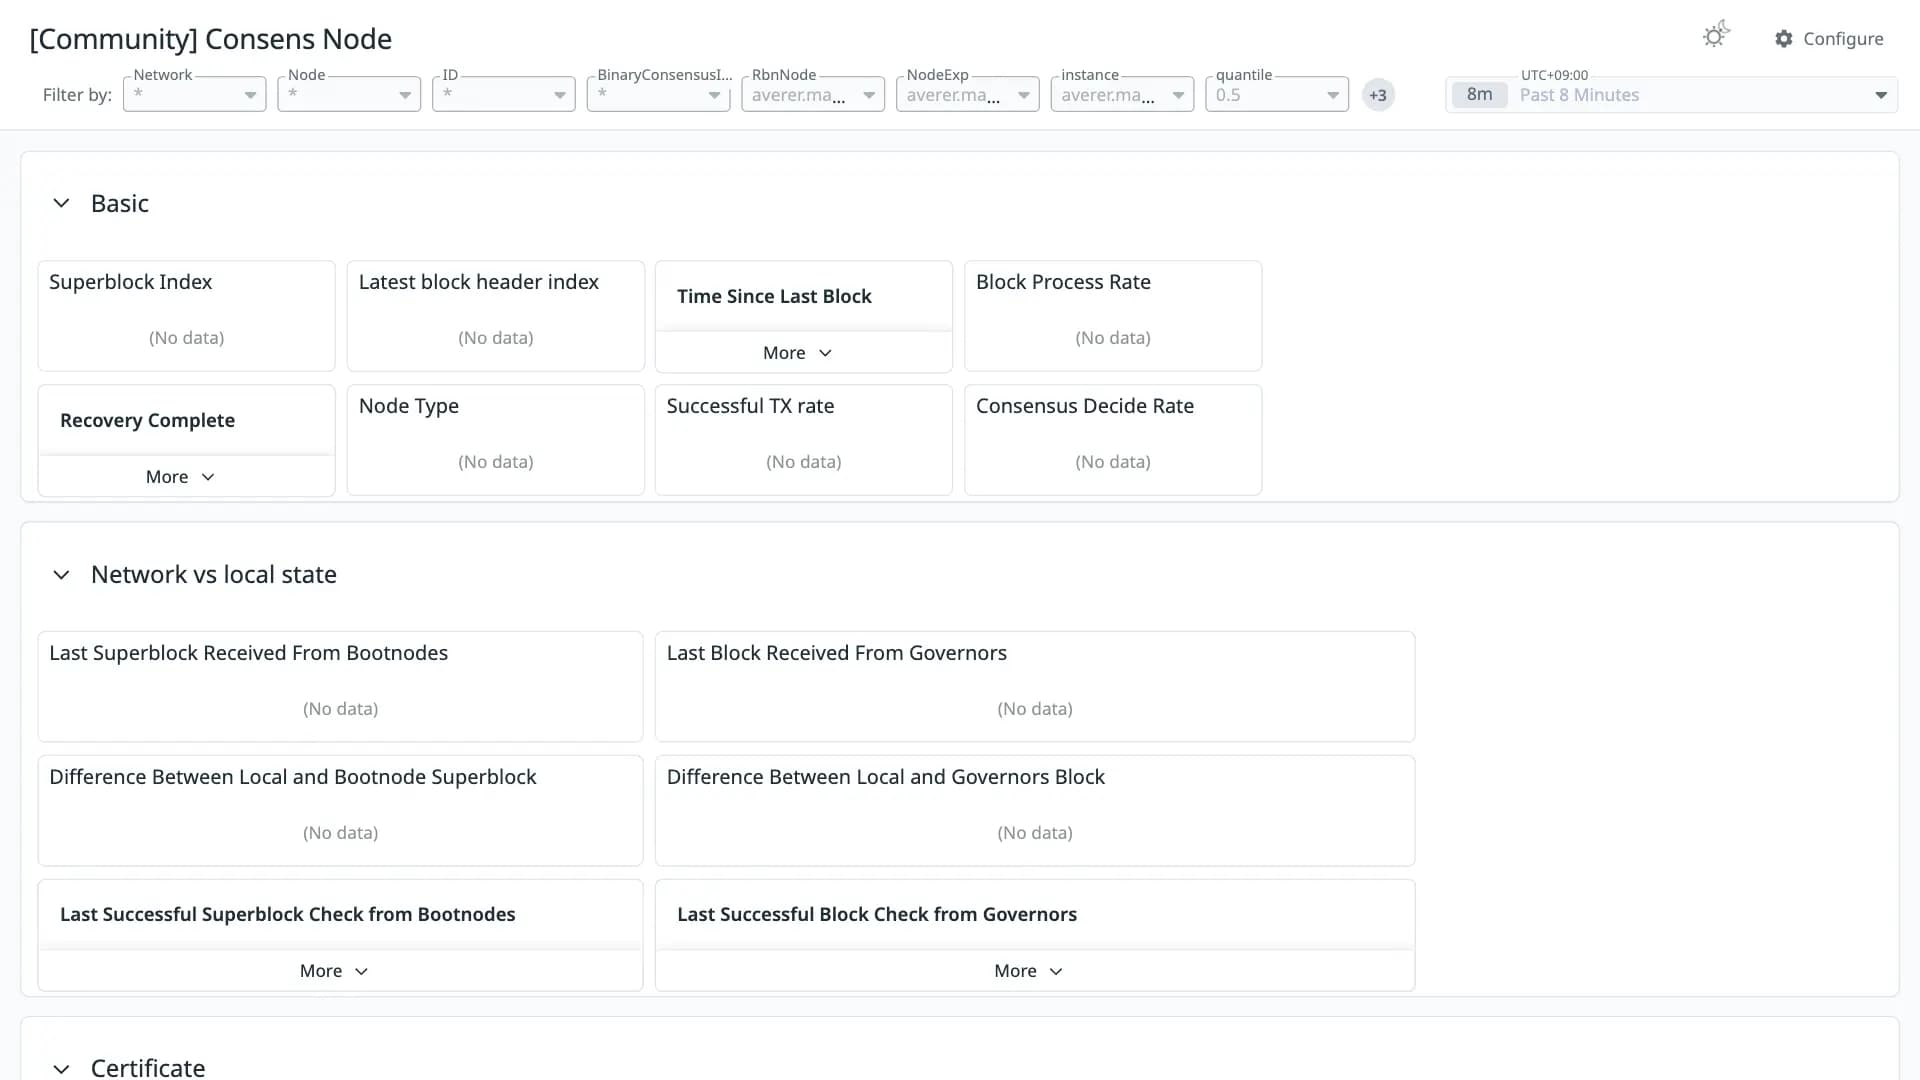
- Time Since Last Block
stat - Recovery Complete
stat - Last Successful Superblock Check from Bootnodes
stat - Last Successful Block Check from Governors
stat - Time Until TLS Certificate Expiry
stat - Time Since TLS Certificate Valid Start
stat - TX Batch Size by Percentile
timeseries - TX Batch Gas cost by Percentile
timeseries - Block Wait Time by Percentile
timeseries - Pending proposals at decision
timeseries - Consensus Wait Time by Percentile
timeseries - Batch count of consensus proposal by percentile
timeseries - Overall RPC Rate
timeseries - RPC Success Count By Operation
timeseries - RPC Failure Count By Operation
timeseries - Time Spent Routing Tx By Percentile
timeseries - Recovery Complete
stat
Integrationssystem
Revisions
- Revision 1Converted from grafana.com revision 4Download JSON
Rate this dashboard
Sign in to rate.0 comments
No comments yet.