Cluster / Global performance
How to import
In Datadog: Dashboards → New Dashboard → ⚙ Configure → Import dashboard JSON → paste this JSON.
Reactions
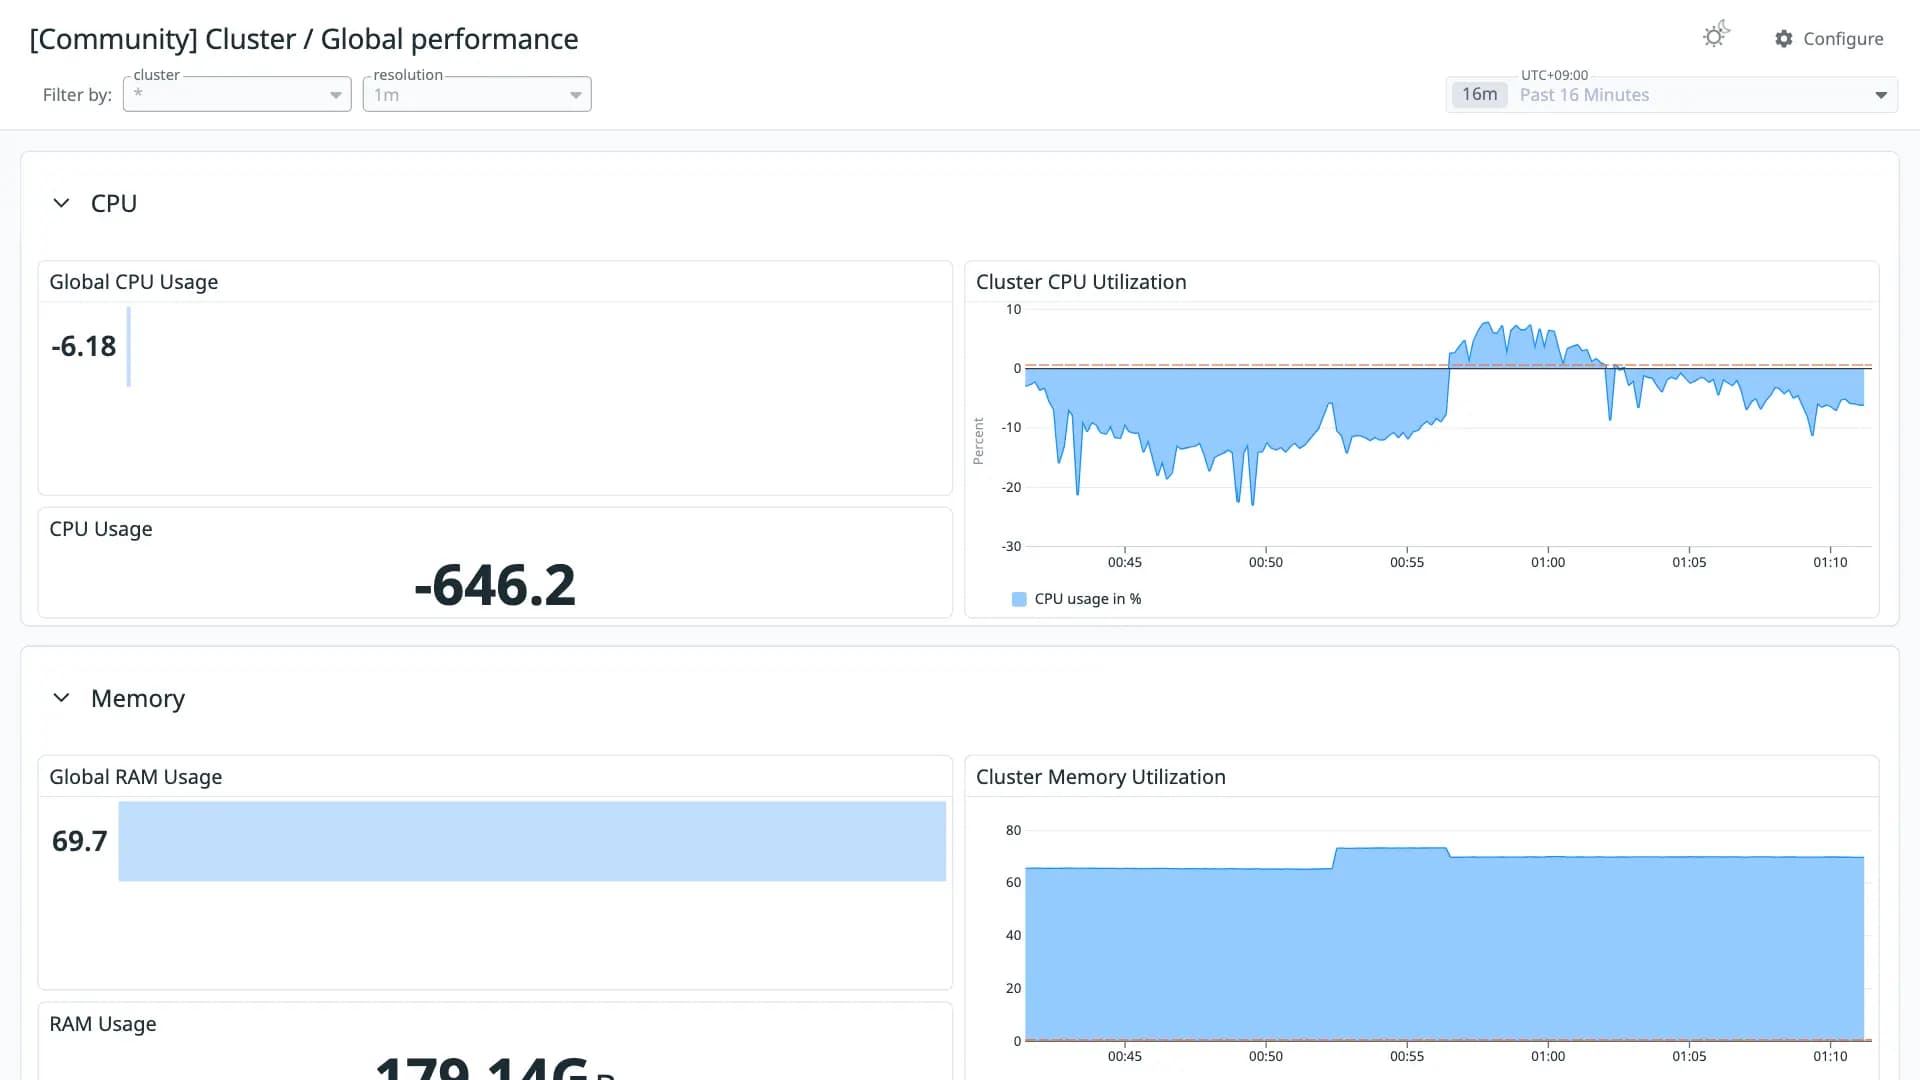
This Grafana dashboard offers a detailed overview of Kubernetes cluster performance and resource usage. It features time series graphs that monitor various metrics, including the number of namespaces, running pods, RAM usage, CPU usage and other key Kubernetes resources such as services, endpoints, and deployments. The dashboard also tracks persistent volume usage both as a percentage and in gigabytes, providing insights into storage utilization. Additionally, it visualizes network usage, coveri
Conversion quality
Fair 79Share of panels whose queries were translated without loss. Partial and unsupported panels keep the original PromQL in a note widget.
- Native6
- OpenMetrics2
- Partial6
- Unsupported0
Metrics without a native Datadog mapping
These metric names were kept in OpenMetrics naming. Adjust them if you collect with a native Datadog integration.
machine_cpu_cores ×3machine_memory_bytes ×3kube_endpoint_infokube_ingress_infokube_deployment_labelskube_statefulset_labelskube_daemonset_labelskube_persistentvolumeclaim_infokube_hpa_labelskube_configmap_infokube_secret_infokube_networkpolicy_labelsRevisions
- Revision 1Converted from grafana.com revision 1Download JSON
Rate this dashboard
Sign in to rate.0 comments
No comments yet.