Cluster cost & utilization metrics
Poor 461 downloads0 views0 commentsRevision 1Created Converted from Grafana dashboard #8670 by kubecost
How to import
In Datadog: Dashboards → New Dashboard → ⚙ Configure → Import dashboard JSON → paste this JSON.
Reactions
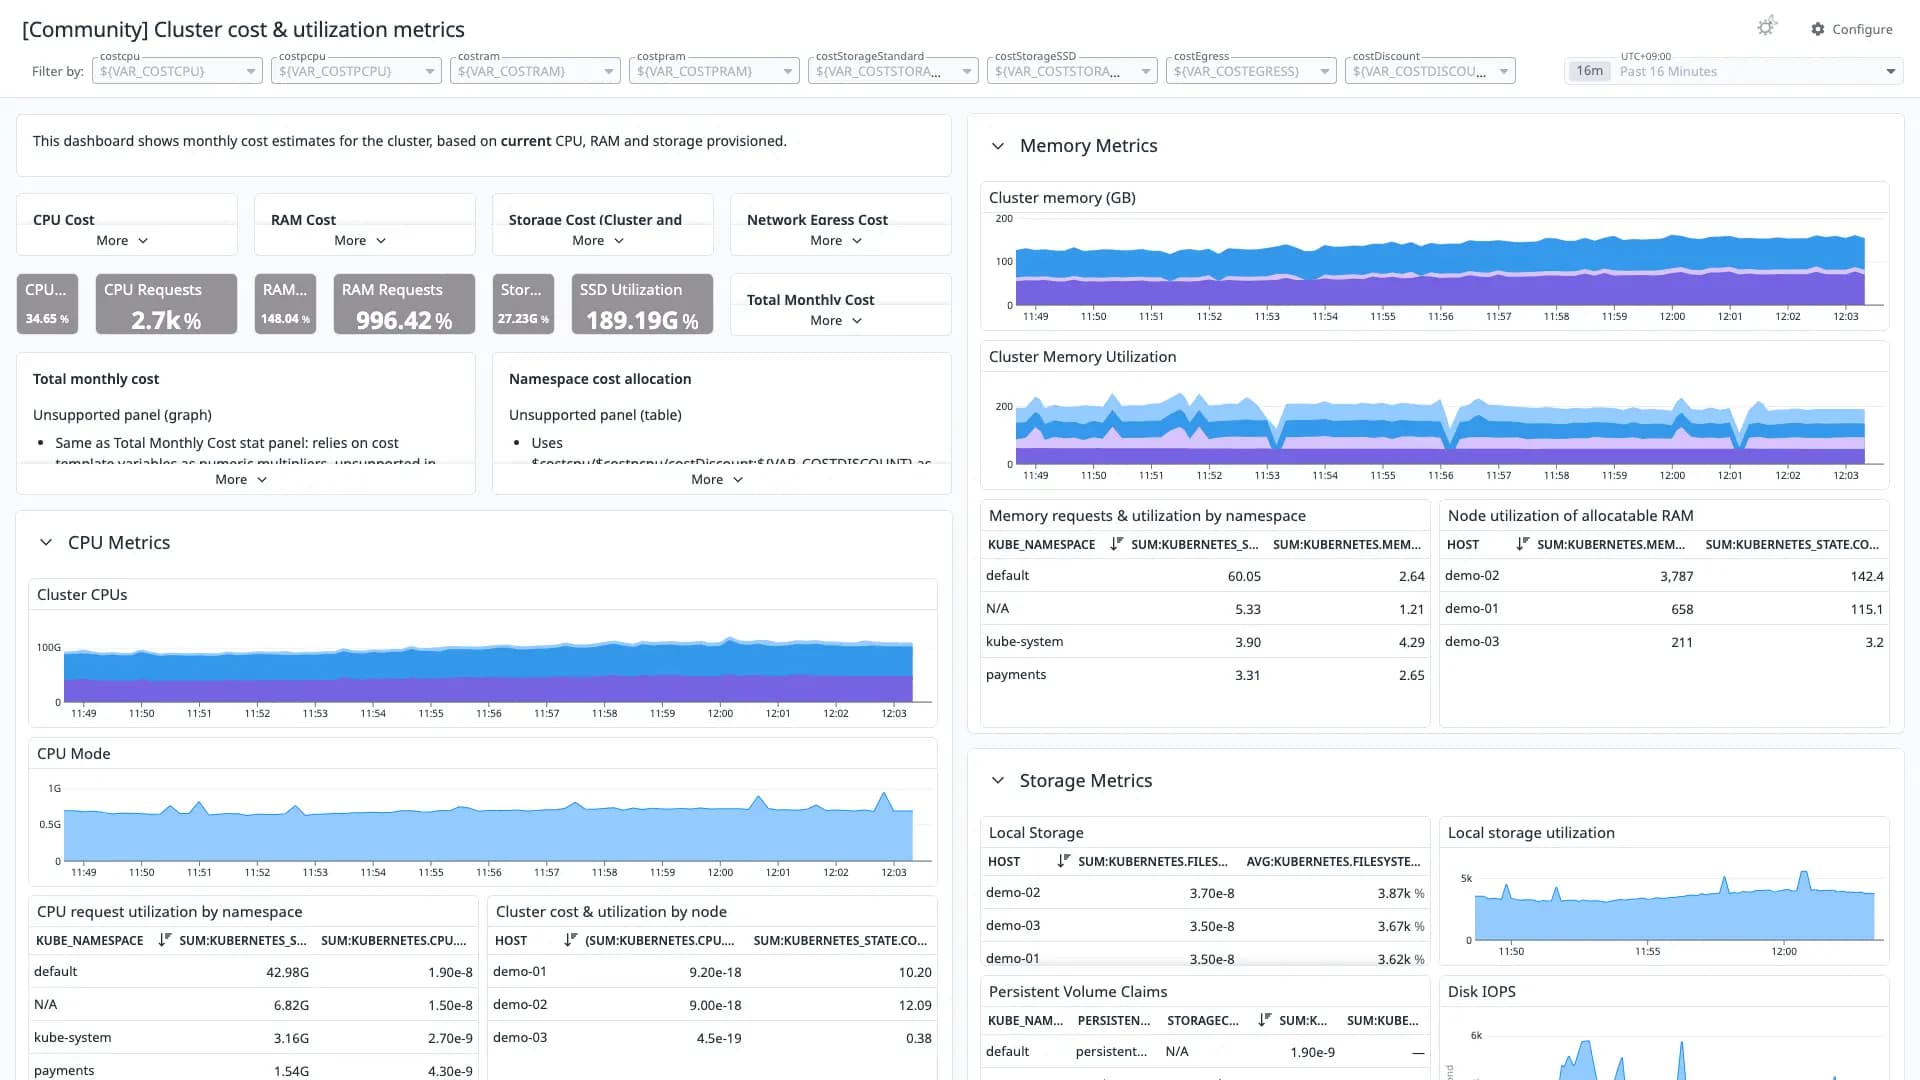
A dashboard to help manage Kubernetes cluster costs and resources
Conversion quality
Poor 46Share of panels whose queries were translated without loss. Partial and unsupported panels keep the original PromQL in a note widget.
- Native7
- OpenMetrics0
- Partial12
- Unsupported9
Unsupported panels
- CPU Cost
singlestat - RAM Cost
singlestat - Storage Cost (Cluster and PVC)
singlestat - Network Egress Cost
singlestat - Total Monthly Cost
singlestat - Total monthly cost
graph - Namespace cost allocation
table - Local Storage
table - Persistent Volume Claims
table
Revisions
- Revision 1Converted from grafana.com revision 5Download JSON
Rate this dashboard
Sign in to rate.0 comments
No comments yet.