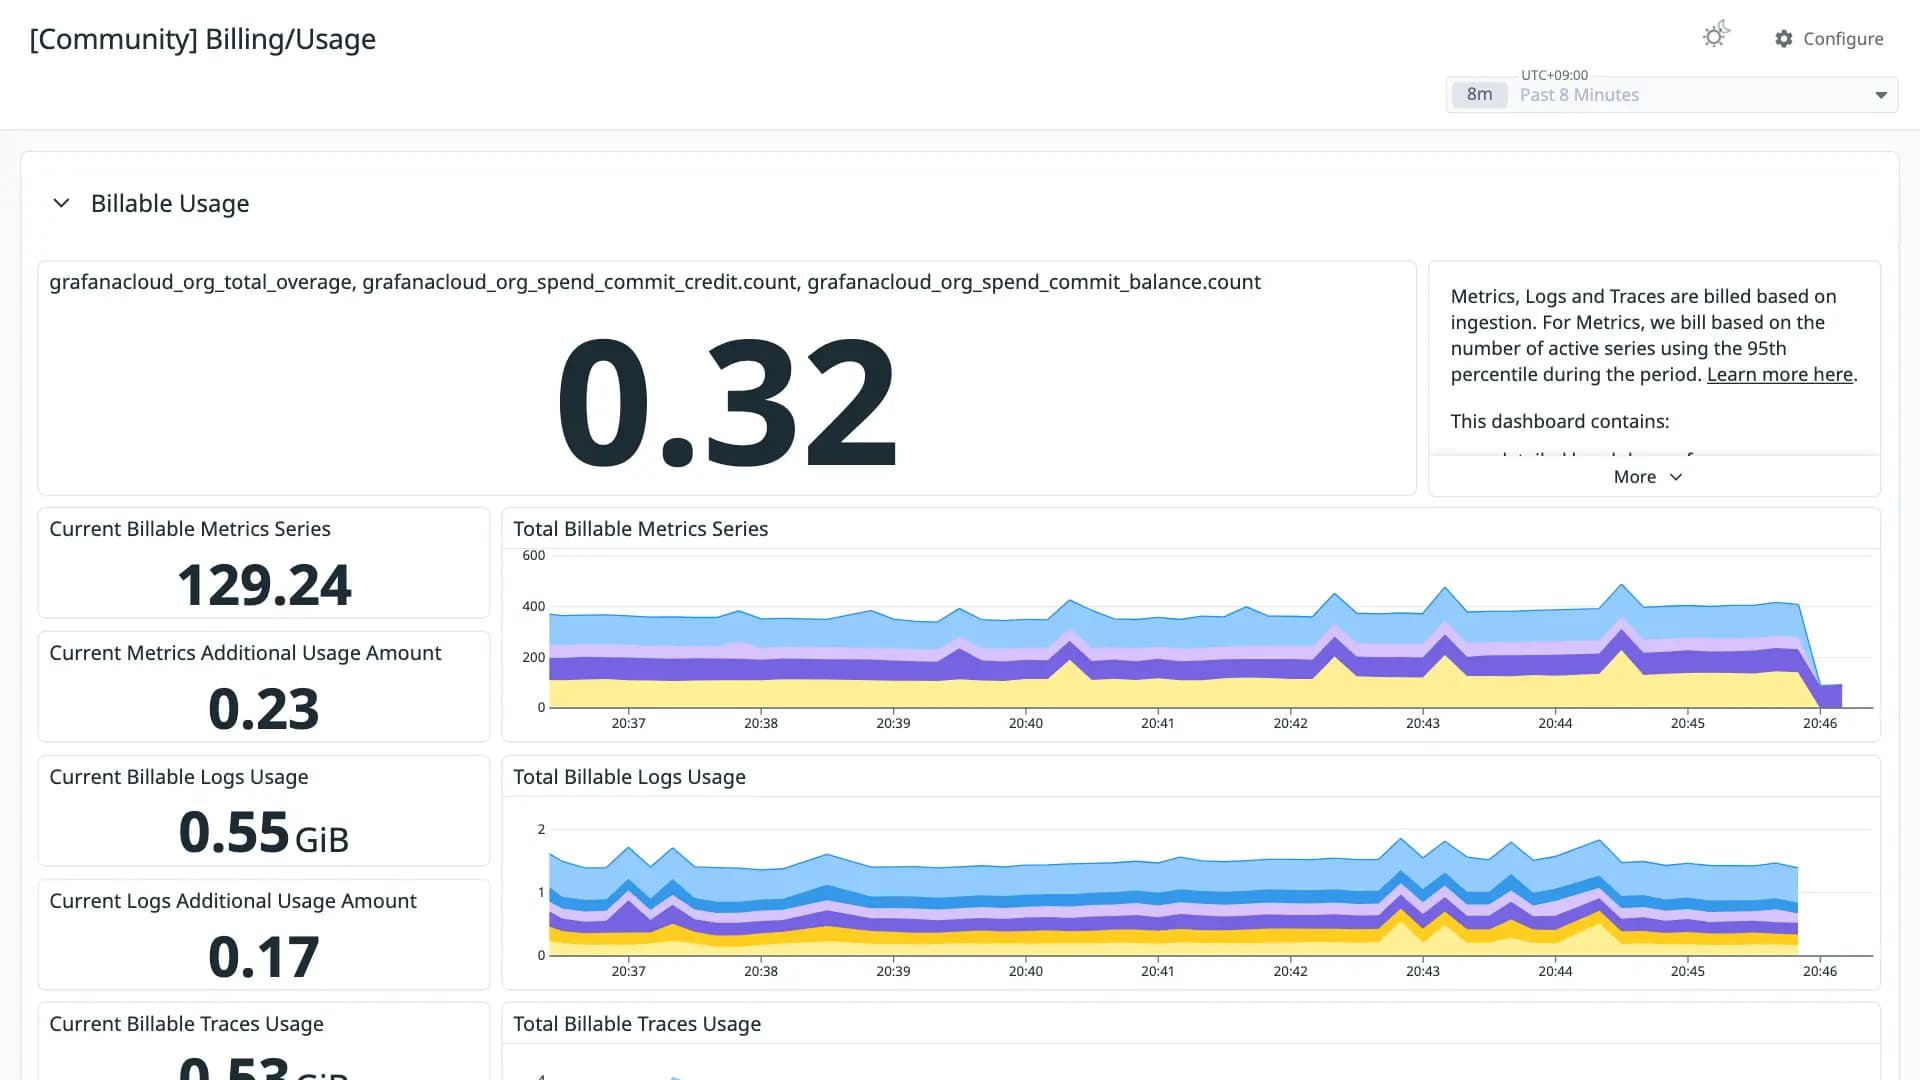
Billing/Usage
가져오는 방법
Datadog에서 Dashboards → New Dashboard → ⚙ Configure → Import dashboard JSON 순으로 이동한 뒤 이 JSON을 붙여넣으세요.
반응
Billing/Usage
변환 품질
낮음 46쿼리가 손실 없이 변환된 패널의 비율입니다. 일부만 변환됐거나 지원되지 않는 패널은 원본 PromQL을 노트 위젯에 그대로 남겨 둡니다.
- 기본 통합2
- OpenMetrics17
- 일부 변환5
- 미지원23
Datadog 기본 통합 메트릭으로 매핑되지 않은 항목
OpenMetrics 이름을 그대로 사용한 메트릭입니다. Datadog 기본 통합으로 수집 중이라면 메트릭 이름을 맞춰 주세요.
grafanacloud_org_metrics_billable_series ×3grafanacloud_org_metrics_overage ×3grafanacloud_org_logs_usage ×3grafanacloud_org_logs_overage ×3grafanacloud_org_traces_usage ×3grafanacloud_org_traces_overage ×3grafanacloud_org_logs_retention_usage ×3grafanacloud_org_logs_retention_overage ×3grafanacloud_org_graphite_metrics_billable_series ×2grafanacloud_org_graphite_metrics_overage ×2grafanacloud_org_grafana_billable_users ×2grafanacloud_org_billable_users_grafana ×2grafanacloud_org_billable_users_oncall ×2grafanacloud_org_grafana_overage ×2grafanacloud_org_grafana_plugin_users ×2grafanacloud_org_grafana_plugin_users_overage ×2grafanacloud_org_total_overagegrafanacloud_org_spend_commit_credit_totalgrafanacloud_org_spend_commit_balance_totalgrafanacloud_org_metrics_included_seriesgrafanacloud_org_graphite_metrics_included_seriesgrafanacloud_instance_billable_usagegrafanacloud_org_logs_included_usagegrafanacloud_logs_instance_usagegrafanacloud_org_traces_included_usagegrafanacloud_traces_instance_usagegrafanacloud_org_grafana_included_usersgrafanacloud_org_logs_retention_included_usagegrafanacloud_logs_instance_retention_usagegrafanacloud_org_k6_virtual_user_hours_usagegrafanacloud_logs_instance_bytes_received_per_second지원되지 않는 패널
- Total Billable Virtual User Hours (VUh)
graph - Current VUh Usage Amount
stat - Current Billable IRM Users
stat - Total Billable IRM Users
graph - Current IRM Users Amount
stat - Current Billable Profiles Usage
stat - Total Billable Profiles Usage
graph - Current Profiles Additional Usage Amount
stat - Metrics Active Series
graph - Highest DPM per series, by stack (top 3 stacks)
gauge - Metrics Ingestion Rate (DPM)
graph - Discarded Metric Samples
graph - Active series per usage group
graph - Total Ingested Logs by Day
graph - Discarded Log Samples
graph - Traces Ingestion Rate
graph - Total Ingested Traces by Day
graph - Discarded Spans
graph - Profiles Ingestion Rate
graph - Total Ingested Profiles by Day
graph - Discarded Profiles
graph - Active Grafana Users (last 30 days)
graph - Grafana Dashboards
graph
리비전 이력
- 리비전 1Converted from grafana.com revision 1JSON 다운로드
이 대시보드 평가하기
평가하려면 로그인이 필요합니다.댓글 0개
아직 댓글이 없습니다.