Bifrost Monitor - Legacy
Good 860 downloads0 views0 commentsRevision 1Created Converted from Grafana dashboard #17725 by thebifrost
How to import
In Datadog: Dashboards → New Dashboard → ⚙ Configure → Import dashboard JSON → paste this JSON.
Reactions
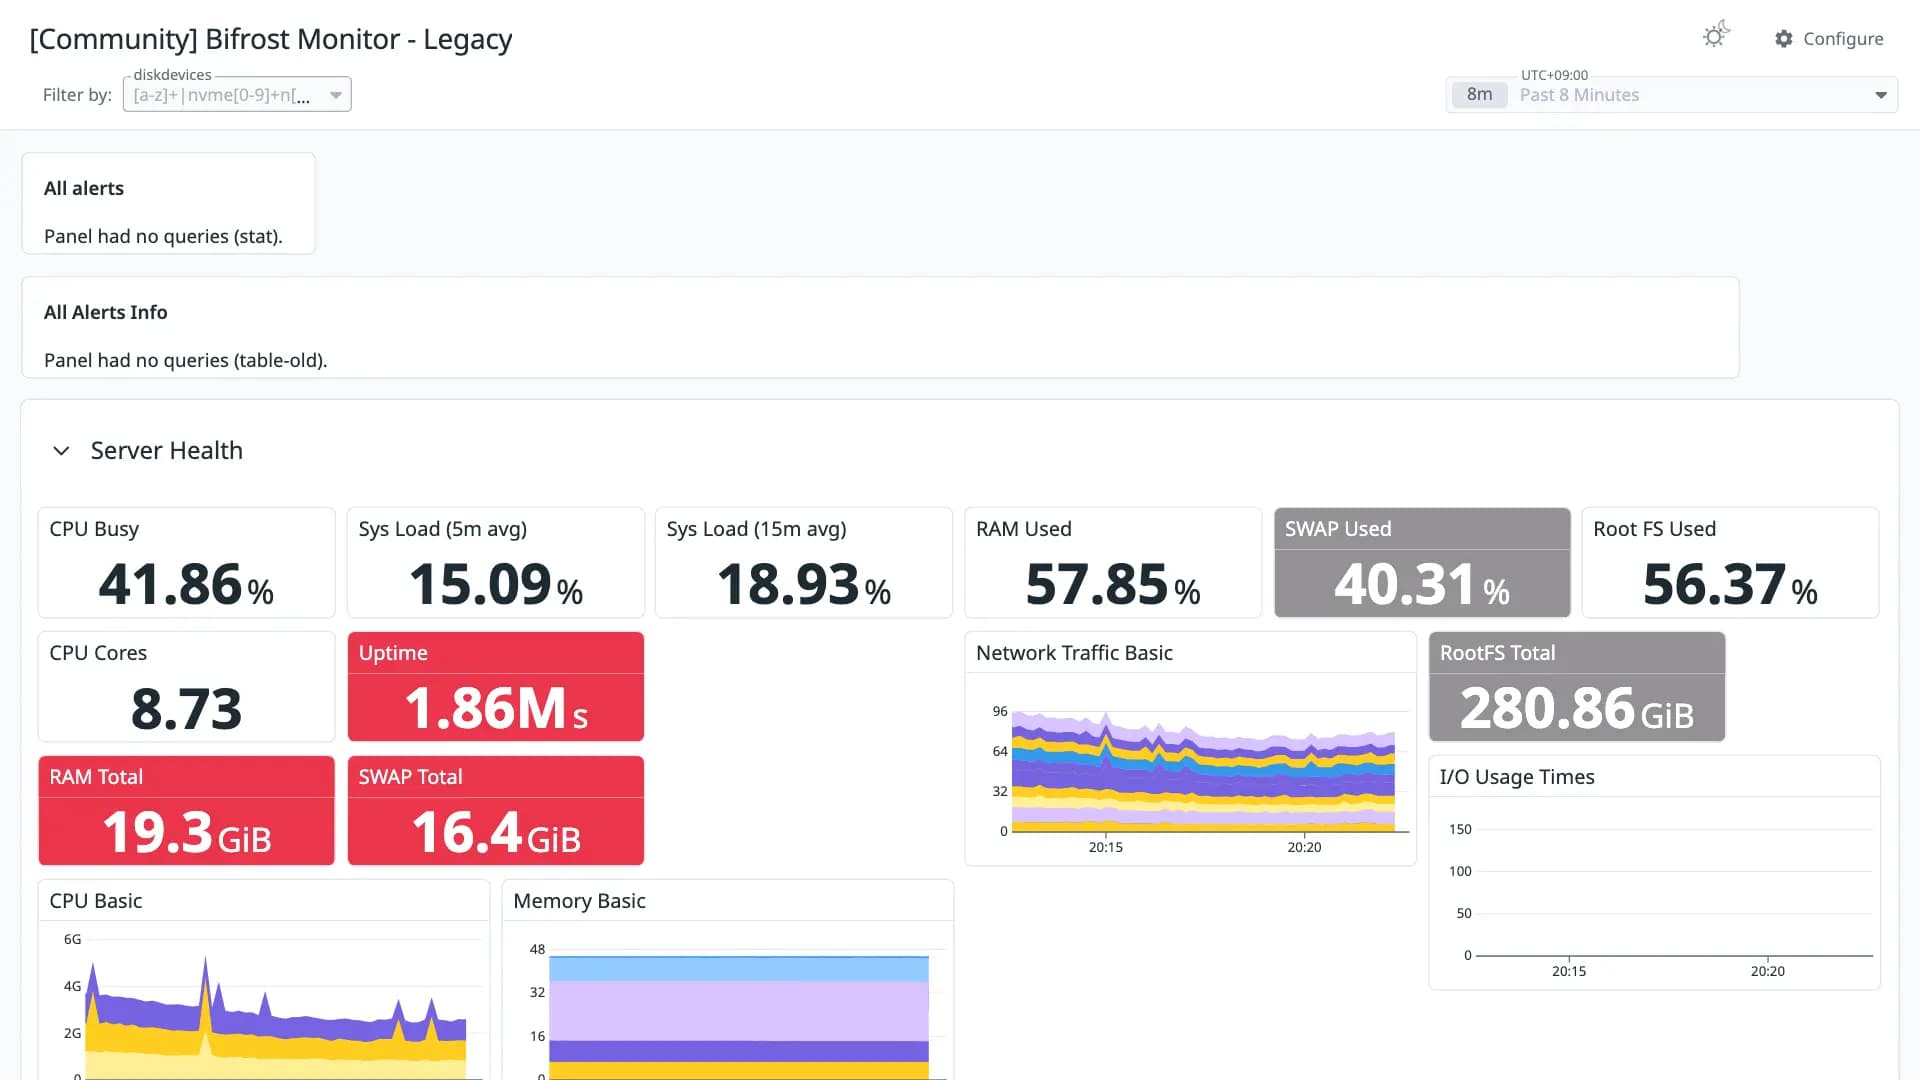
bifrost-node & bifrost-relayer monitoring dashboard
Conversion quality
Good 86Share of panels whose queries were translated without loss. Partial and unsupported panels keep the original PromQL in a note widget.
- Native11
- OpenMetrics21
- Partial8
- Unsupported2
Metrics without a native Datadog mapping
These metric names were kept in OpenMetrics naming. Adjust them if you collect with a native Datadog integration.
substrate_block_height ×4relayer_status_counter_starts_on_chain_index_total ×4substrate_rpc_calls_started ×2namedprocess_namegroup_memory_bytessubstrate_sub_libp2p_network_bytes_totalsubstrate_ready_transactions_numbersubstrate_sub_libp2p_peers_countsubstrate_state_cache_bytessubstrate_sync_queued_blockssubstrate_tasks_polling_started_totalsubstrate_tasks_polling_duration_countrelayer_heartbeat_sum_totalrelayer_running_sessionsrelayer_rpc_requests_on_bifrostrelayer_rpc_requests_on_ethereumrelayer_rpc_requests_on_binancerelayer_rpc_requests_on_polygonrelayer_rpc_failures_on_bifrostrelayer_rpc_failures_on_binancerelayer_rpc_failures_on_ethereumrelayer_rpc_failures_on_polygonrelayer_prices_of_symbolrelayer_btc_heightrelayer_incomplete_gauge_of_chainrelayer_chain_rounds_of_chainUnsupported panels
- Relative Block Production Speed
graph - Thread Healthy Check
status-history
Integrationssystem
Revisions
- Revision 1Converted from grafana.com revision 1Download JSON
Rate this dashboard
Sign in to rate.0 comments
No comments yet.