Azure / Insights / Applications / OTel / RPC Delta
Poor 40 downloads0 views0 commentsRevision 1Created Converted from Grafana dashboard #25050 by azure
How to import
In Datadog: Dashboards → New Dashboard → ⚙ Configure → Import dashboard JSON → paste this JSON.
Reactions
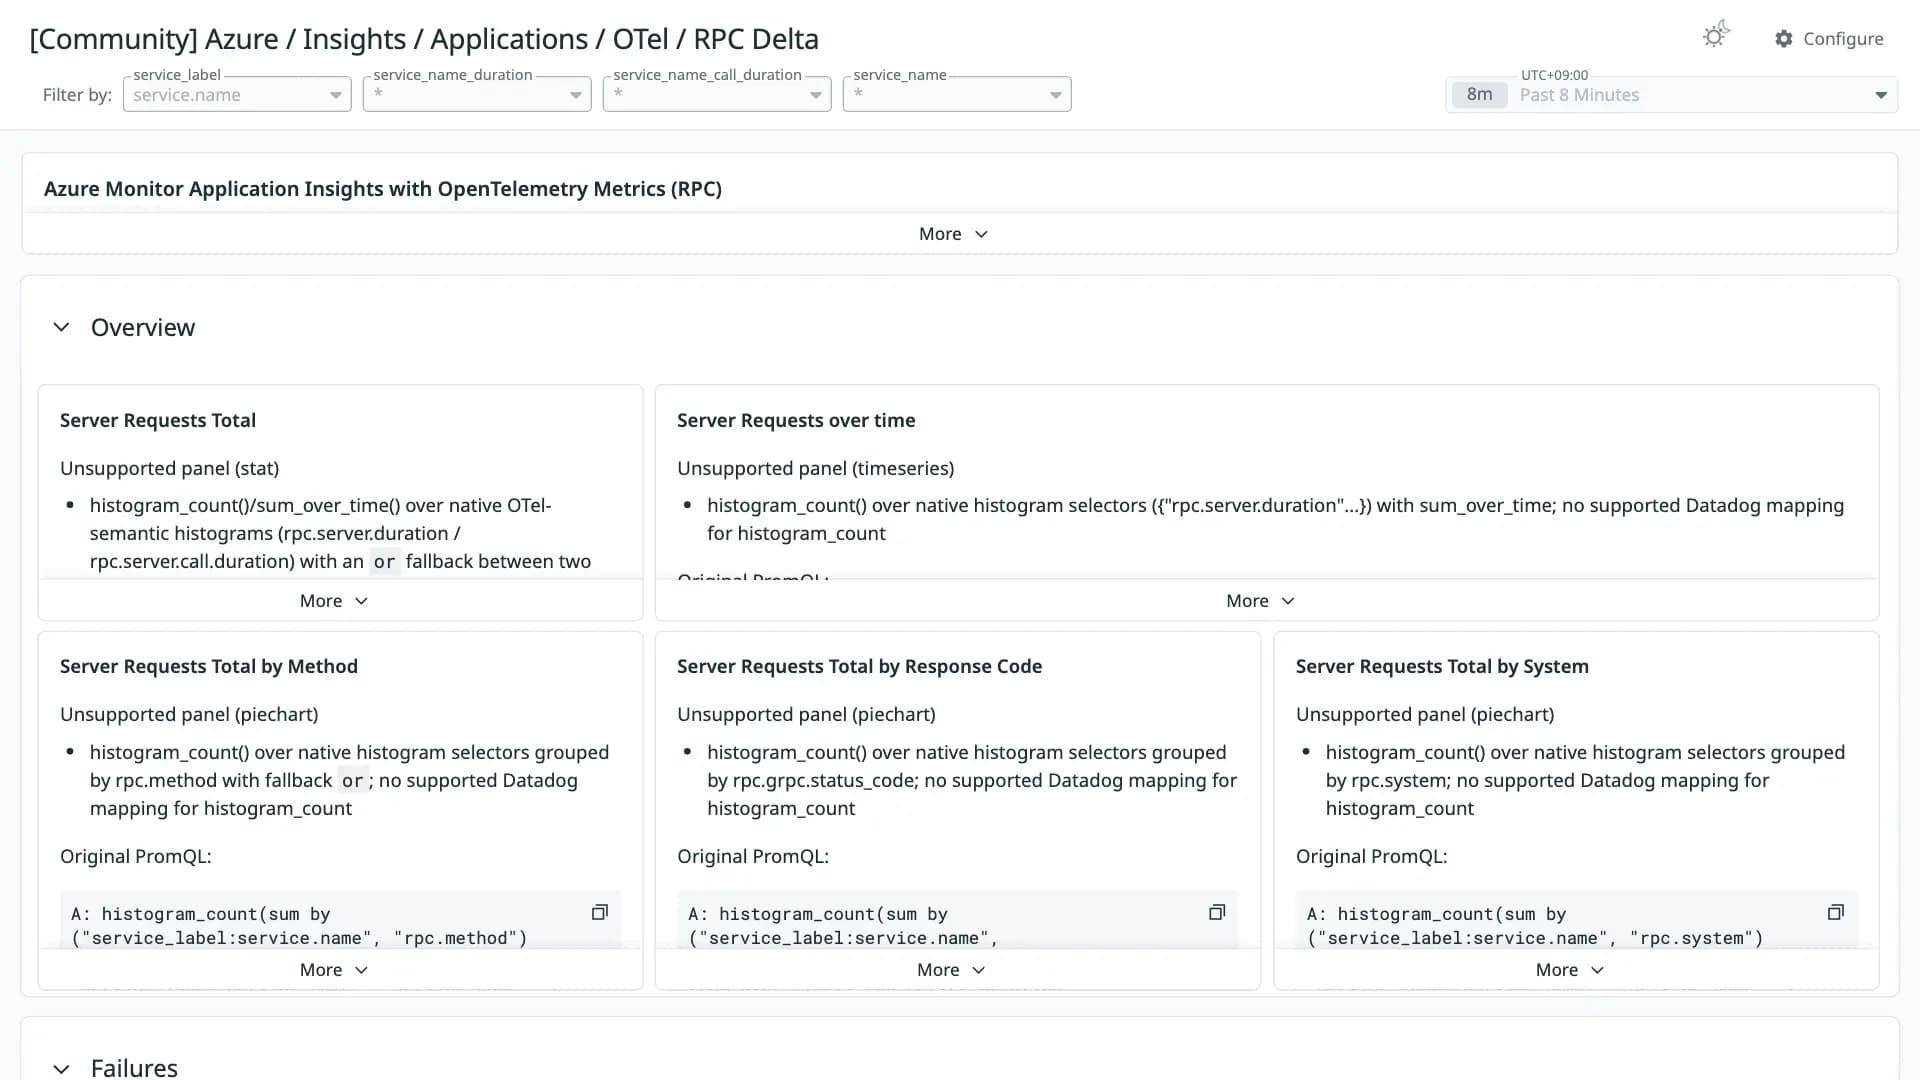
OpenTelemetry dashboard providing RPC call delta metrics.
Conversion quality
Poor 4Share of panels whose queries were translated without loss. Partial and unsupported panels keep the original PromQL in a note widget.
- Native1
- OpenMetrics0
- Partial0
- Unsupported22
Unsupported panels
- Server Requests Total
stat - Server Requests over time
timeseries - Server Requests Total by Method
piechart - Server Requests Total by Response Code
piechart - Server Requests Total by System
piechart - Failed Server Requests Total by Response Code
stat - Failed Server Requests Total by Response Code
timeseries - Failed Client Requests Total by Response Code
stat - Failed Client Requests Total by Response Code
timeseries - Average Server Response Time (seconds)
timeseries - Average Server Response Time by Method (seconds)
timeseries - 95th Percentile Server Response Time (seconds)
timeseries - 95th Percentile Server Response Time by Method (seconds)
timeseries - Average Server Request Rate (rps)
timeseries - Average Server Request Rate (rps) by Method
timeseries - Average Server Response Time (seconds)
bargauge - Average Server Response Time by Route (seconds)
bargauge - Average Client Response Time (seconds)
timeseries - Average Client Response Time by HTTP Route and RPC method (seconds)
timeseries - 95th Percentile - Client Response Time (seconds)
timeseries - 95th Percentile - Client Response Time by HTTP Route and RPC Method (seconds)
timeseries - Average Server Response Time (milliseconds)
table
Tagsazure-managed
Revisions
- Revision 1Converted from grafana.com revision 2Download JSON
Rate this dashboard
Sign in to rate.0 comments
No comments yet.